Loading...
Skip to Content

Data Intelligence Platform

Ontologic Platform

A data intelligence platform that unifies scattered databases, legacy code, and operational documents into a single ontology-based semantic layer, delivering natural-language queries, root-cause analysis, What-if prediction, and watch-agent automation

What agents need is not more data, but “meaning”

Give an LLM agent nothing but a DB schema and an API, and it can read column names and types but never understands the “why.” An ontology fills that gap — we take a closer look below.

Ontologic Platform is a data intelligence platform that builds this ontology automatically from documents and DB schemas, connects it to live data, and delivers natural-language queries, root-cause analysis, What-if prediction, and watch-agent automation in a single flow. The UI is organized into three layers: the Physical Layer (data sources, code, schemas, natural-language queries), the Domain Layer (ObjectTypes and ontology management), and the Dynamic Layer (What-if simulator and watch agents).

Why Ontology, Why Now

As agentic AI begins to work directly with data, the new bottleneck is no longer “access rights” but “knowledge of meaning and causality.”
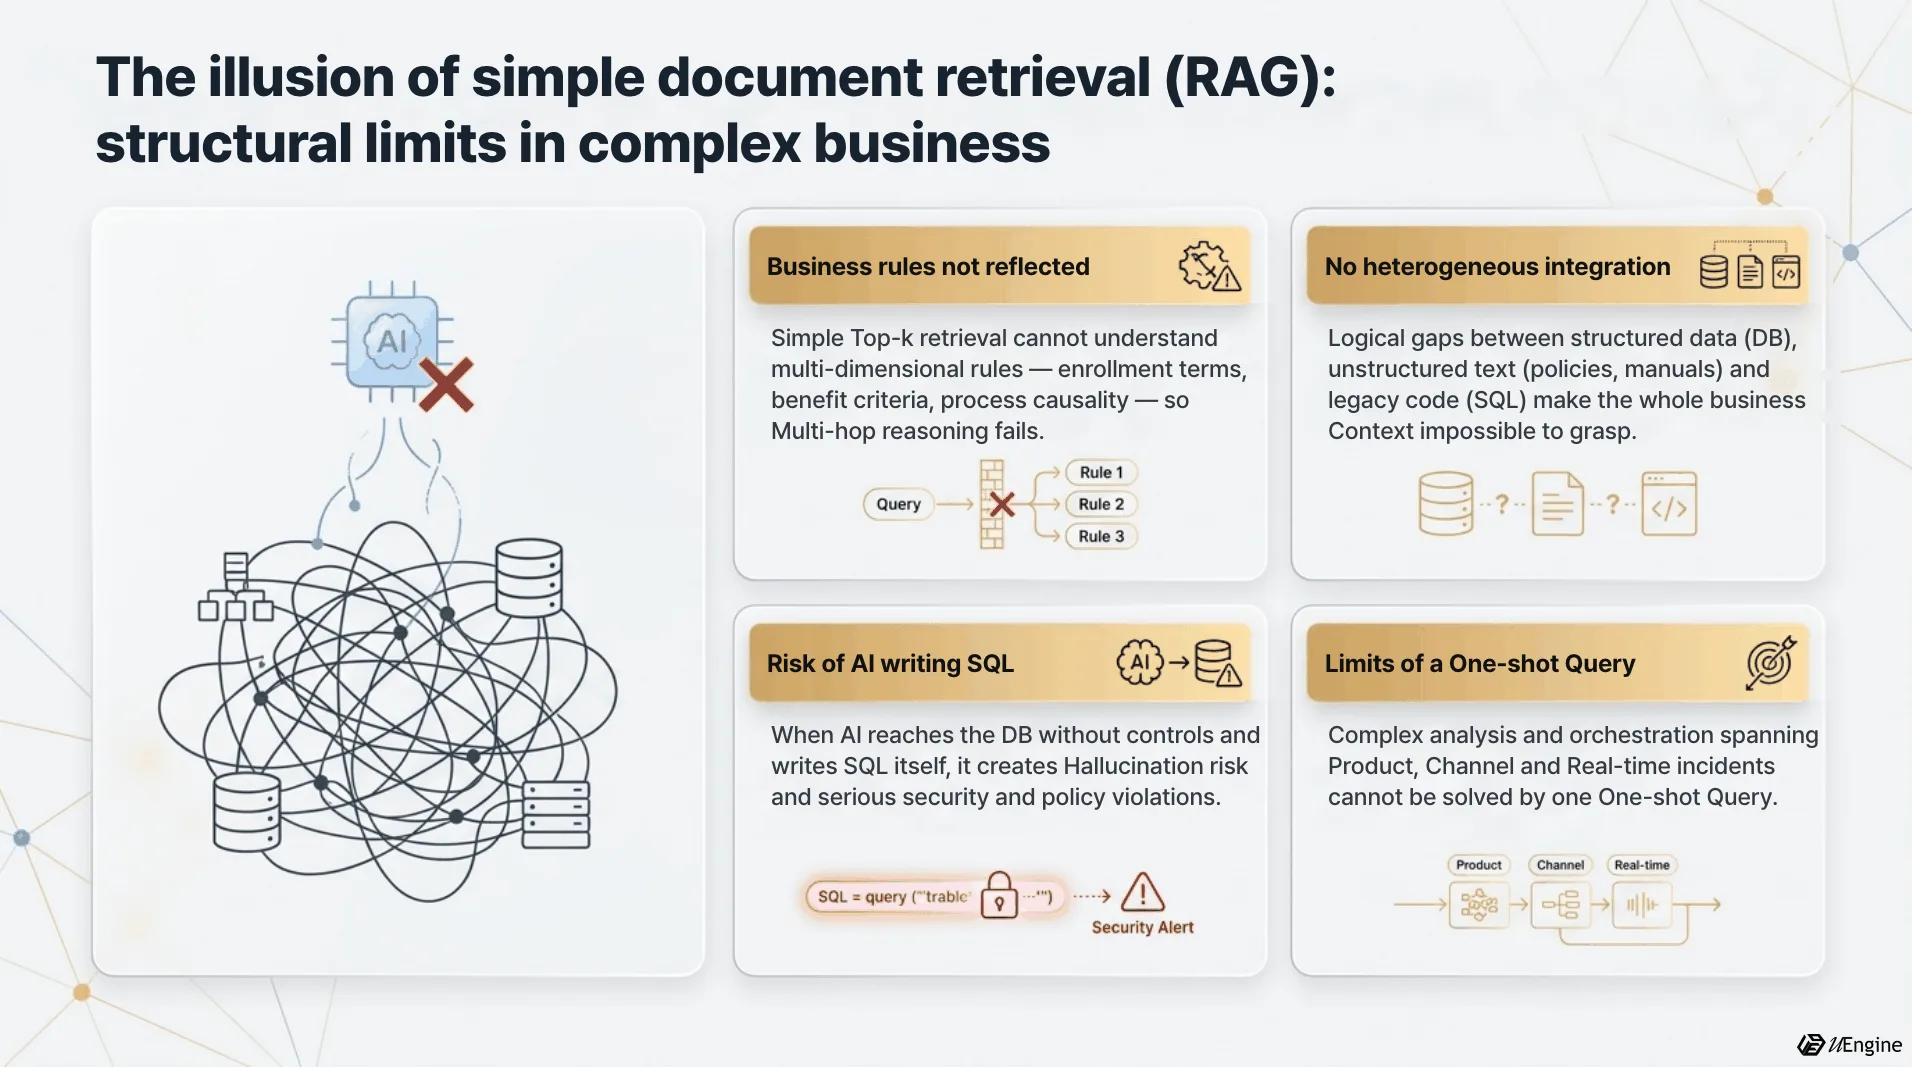
The illusion of simple document retrieval (RAG): structural limits in the face of complex business

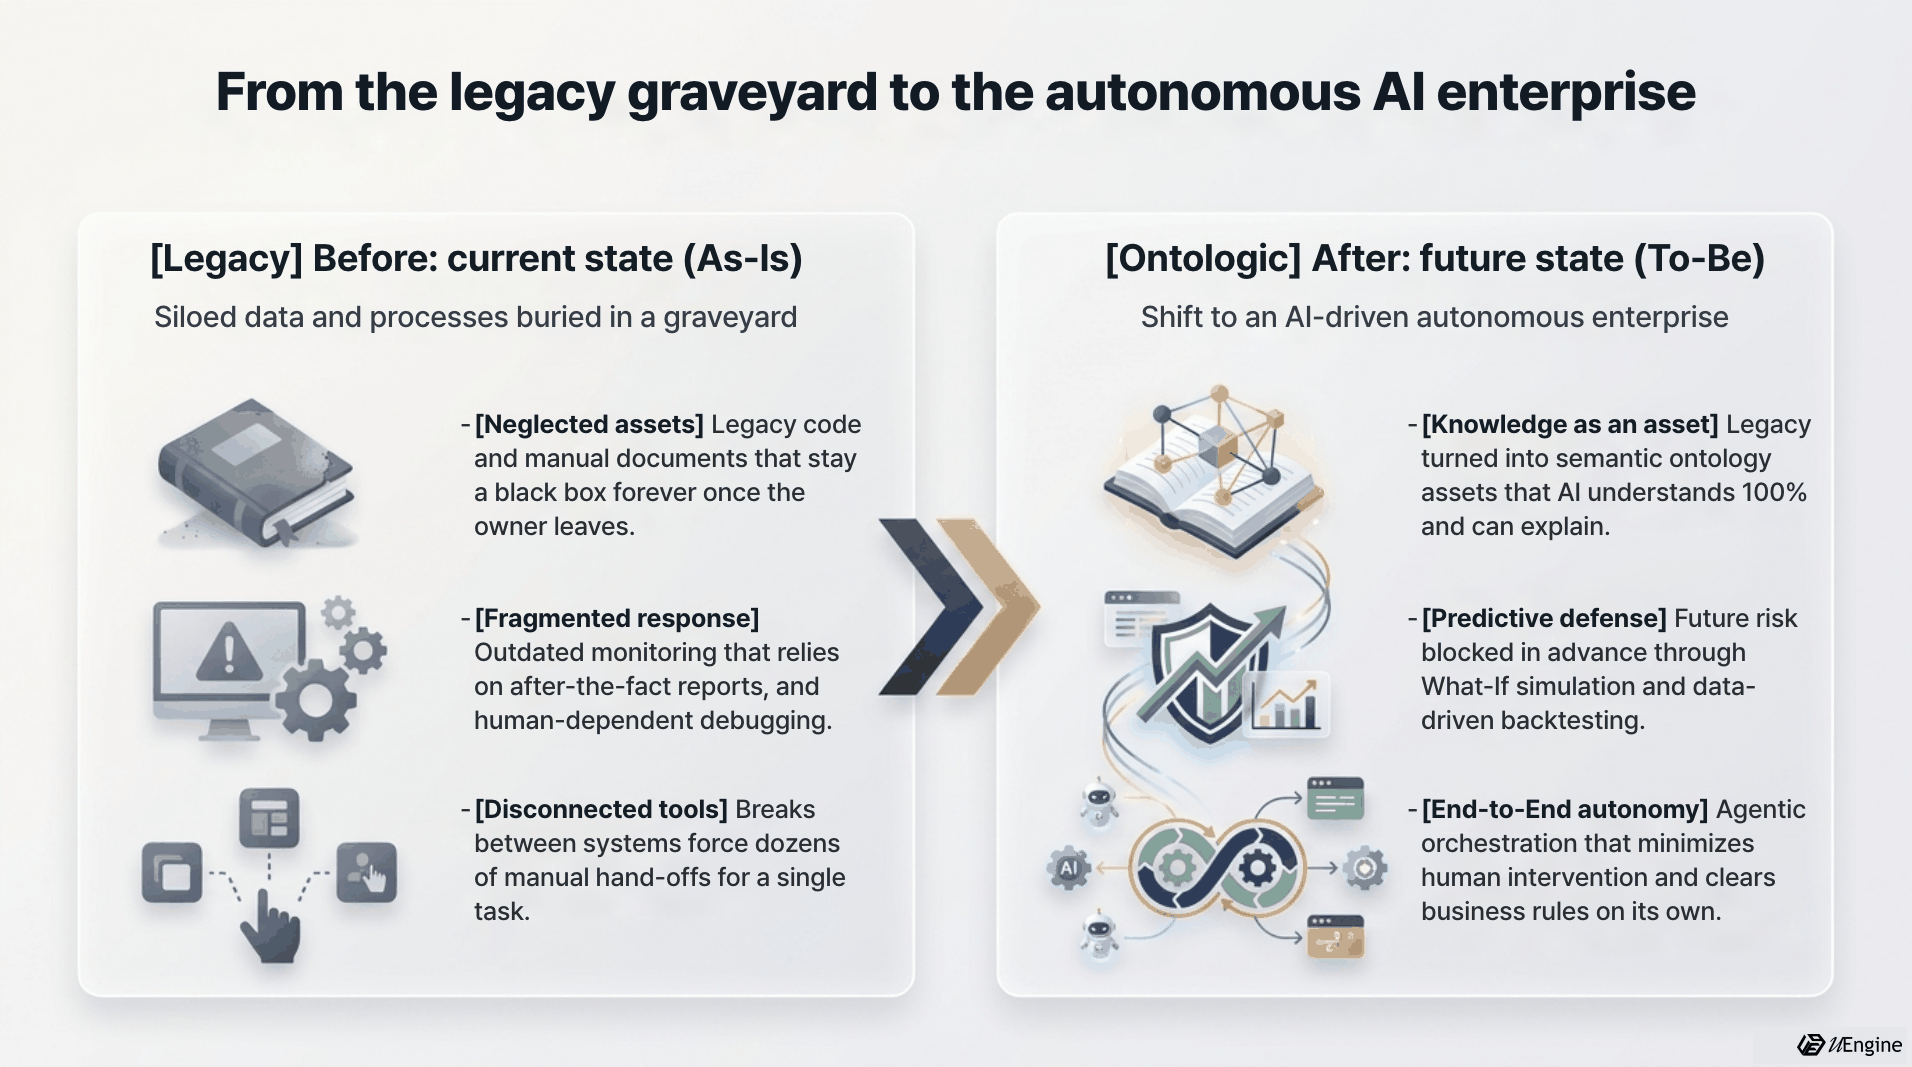
Problem — Data without meaning makes agents dangerous

Schemas and APIs alone cannot tell you “what affects what.” An agent that decides without grounding risks executing the wrong action.

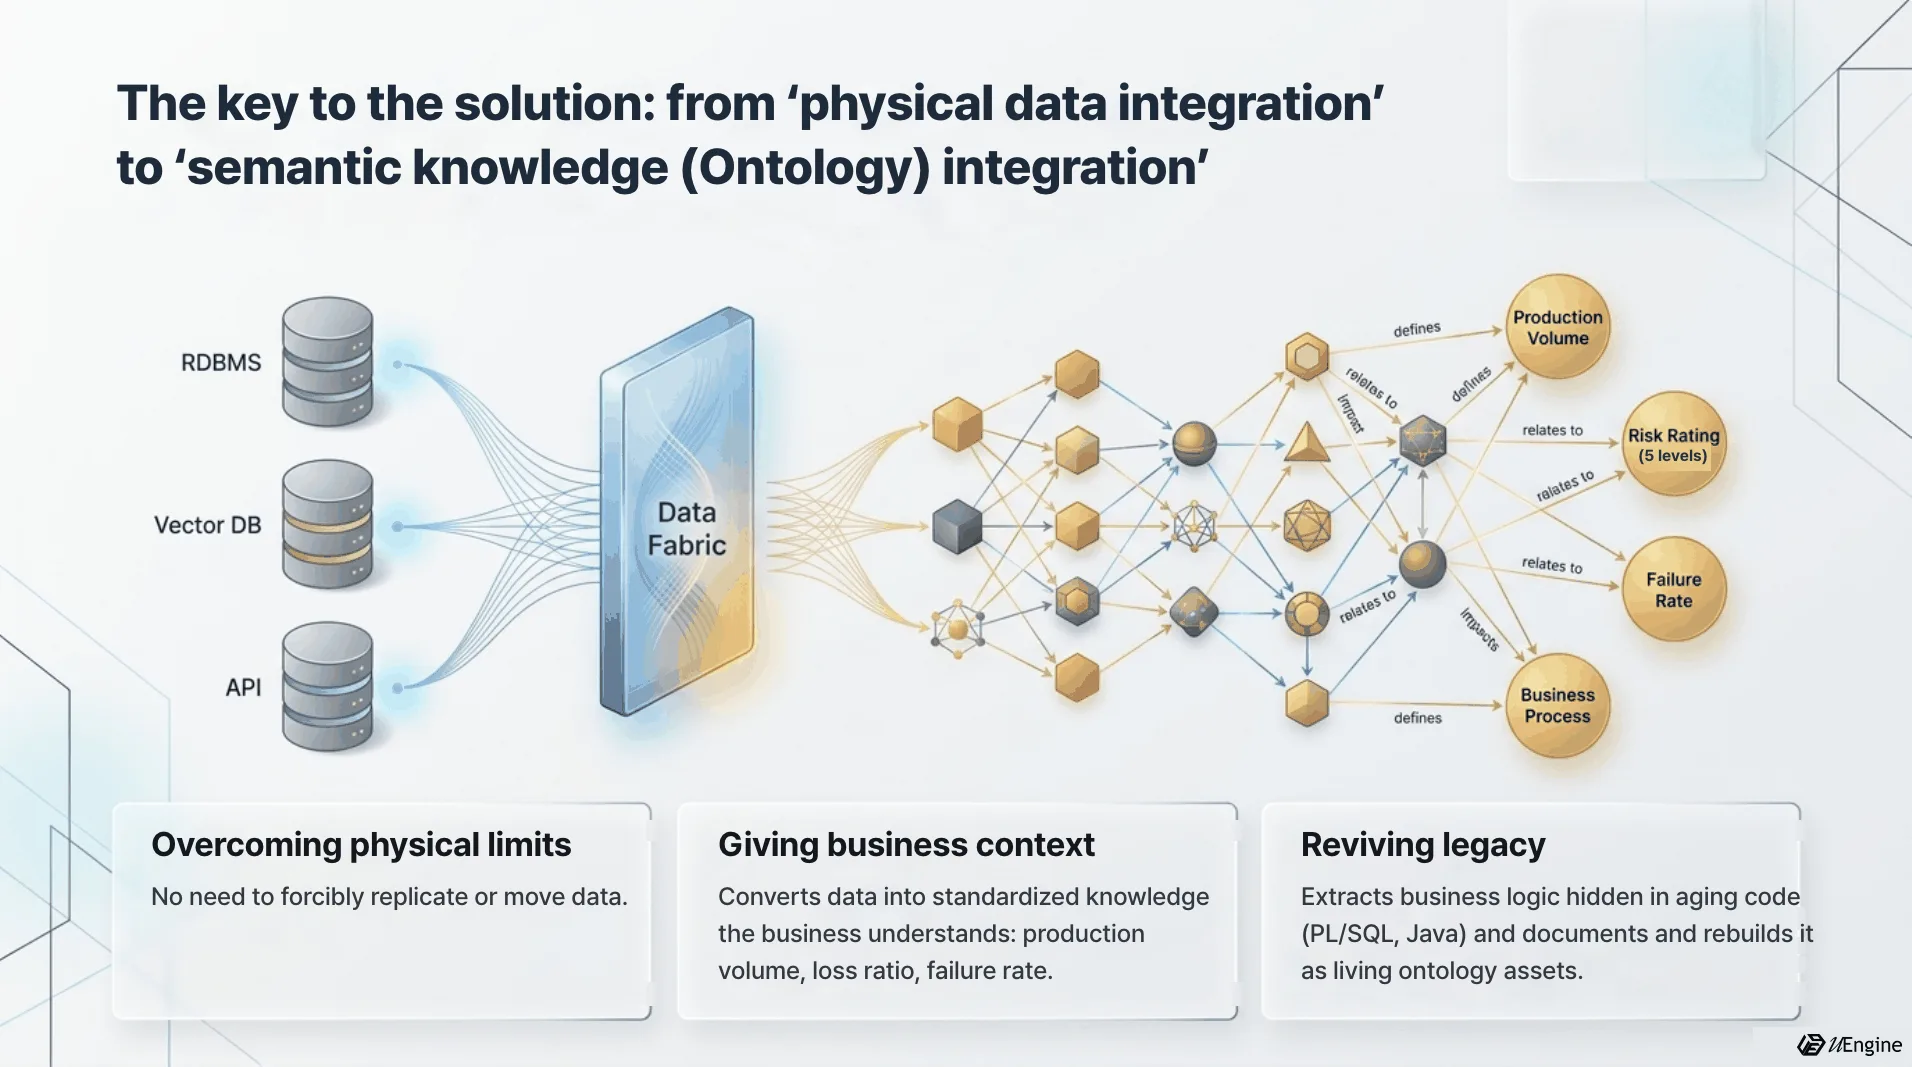
The key: from physical data integration to semantic knowledge (ontology) integration

Solution — Give data meaning and causality with an ontology

An ontology composed of KPI, Measure, Process, Driver, and Resource makes the causal, measurement, and production relationships between data explicit as a graph, creating the grounding needed to explain “why.”

From the legacy graveyard to the autonomous AI enterprise: Before/After

Outcome — Agentic AI that automates on grounded decisions

An agent that consults the ontology validates outcomes first through root-cause analysis and What-if prediction, and only then executes the action, making trustworthy automation possible.


The Three Core Layers of the Ontology

Ontologic is built from three core layers, Physical, Domain, and Dynamic, forming one continuous flow from physical data assets through the semantic layer to the execution/automation layer.

Physical Layer

Manages physical data assets: data sources, code (DDL and stored procedures), schema management, and natural-language queries.

Domain Layer

Manages the semantic layer: domain schemas, ObjectTypes (semantic objects), and ontology management.

Dynamic Layer

Owns the execution/automation layer: the What-if simulator, event detection, and watch agents.

Agents Collaborating on the Ontology

When a business process hands an agent a mission, the agent reasons by consulting the relevant nodes in the ontology network, aligns with the business strategy (which is itself part of the ontology), and feeds the result back into the process as an executed action.

Layered ontology architecture and agent collaboration Four layers, Process, Agent, Ontology, and Data, are stacked top to bottom. The Ontology layer holds a knowledge graph of KPI, Measure, Process, Driver, Resource, and Strategy nodes, while the Data layer shows RDBMS, document, and API icons. The agent starts in the Data layer, consults the Assembly Process and Defect Rate nodes in the ontology network, aligns with the Quality-First Strategy node, passes through the Agent layer, and returns to action execution in the Process layer. Business strategy is part of the ontology network, too. PROCESS LAYER · Agentic BPM Anomaly detected Defective? 🎯 Issue mission Quality inspection process ✅ Execute action Process GPT integration AGENT LAYER · Multi-agent framework 🔗 LangChain 🕸️ MCP Ontology link 👥 CrewAI ONTOLOGY LAYER · Semantic knowledge graph (Neo4j) Raw material supply Legacy code 🔍 Robo Analyzer Operator Assembly process Quality inspection process Equipment temperature Defect rate On-time delivery rate Production volume Quality-first strategy Cost-reduction strategy Strategy is part of the ontology, too DATA LAYER · Data fabric 🗄️ RDBMS·NoSQL 📄 🗂️ Documents · Legacy code (DDL · SP) 🔌 API · Event streams ⚙️ Zero-ETL Fabric KPI Measure Process Driver Resource Strategy 🕸 Ontologic Platform
📥 Data ingestion: raw materials · legacy code
🔗 Ontology lookup: assembly process → defect rate
🧭 Strategy alignment: matches quality-first strategy
✅ Execute: launch quality inspection process

This animation shows the agent (the glowing dot) starting in the Data layer, consulting the Assembly Process and Defect Rate nodes in the ontology network, aligning with the quality-first strategy, passing through the Agent layer, and returning to action execution in the Process layer.


End-to-End Usage Flow

From scattered data to proactive action, Ontologic works in four steps

1. Data integration

Register data sources through 100+ connectors, and use an LLM to analyze and ingest even legacy code.

2. Semantic modeling

Promote data into semantic units with natural-language queries and ObjectTypes, and build an ontology from documents and schemas.

3. Analysis & prediction

Map live data onto the ontology and run root-cause analysis (VAR/Granger) and What-if simulations.

4. Automation

Watch agents continuously evaluate conditions and automatically launch a preemptive action process when a threshold is crossed.

Key Features

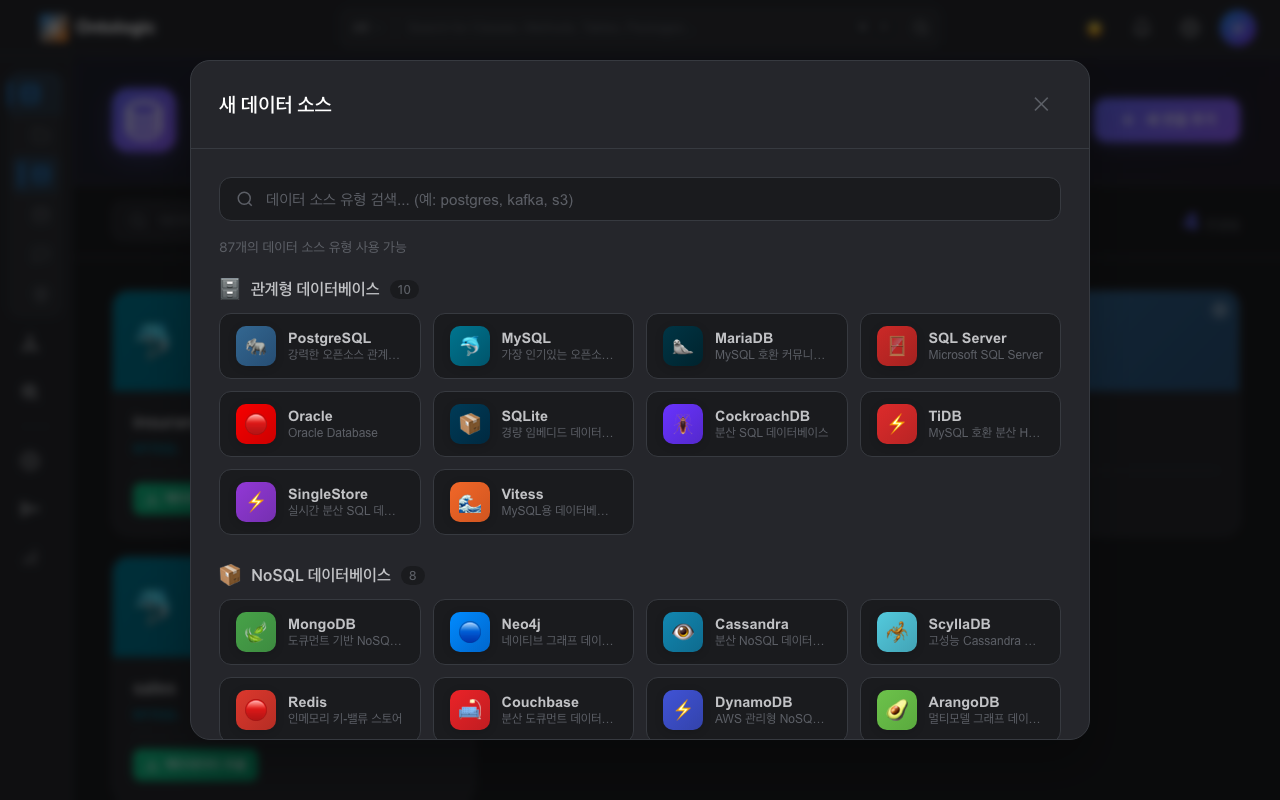
Data source registration catalog

Data Source Registration

Supports 100+ connectors, from relational databases, NoSQL, analytics/search engines, and vector DBs to REST APIs and SaaS (Stripe, Salesforce, Slack, and more). After a connection test, metadata is extracted automatically the moment a source is registered.

100+ connectors for DB, NoSQL, vector DB, and SaaS
Automatic metadata extraction after connection test
Select data sources to target with natural-language queries
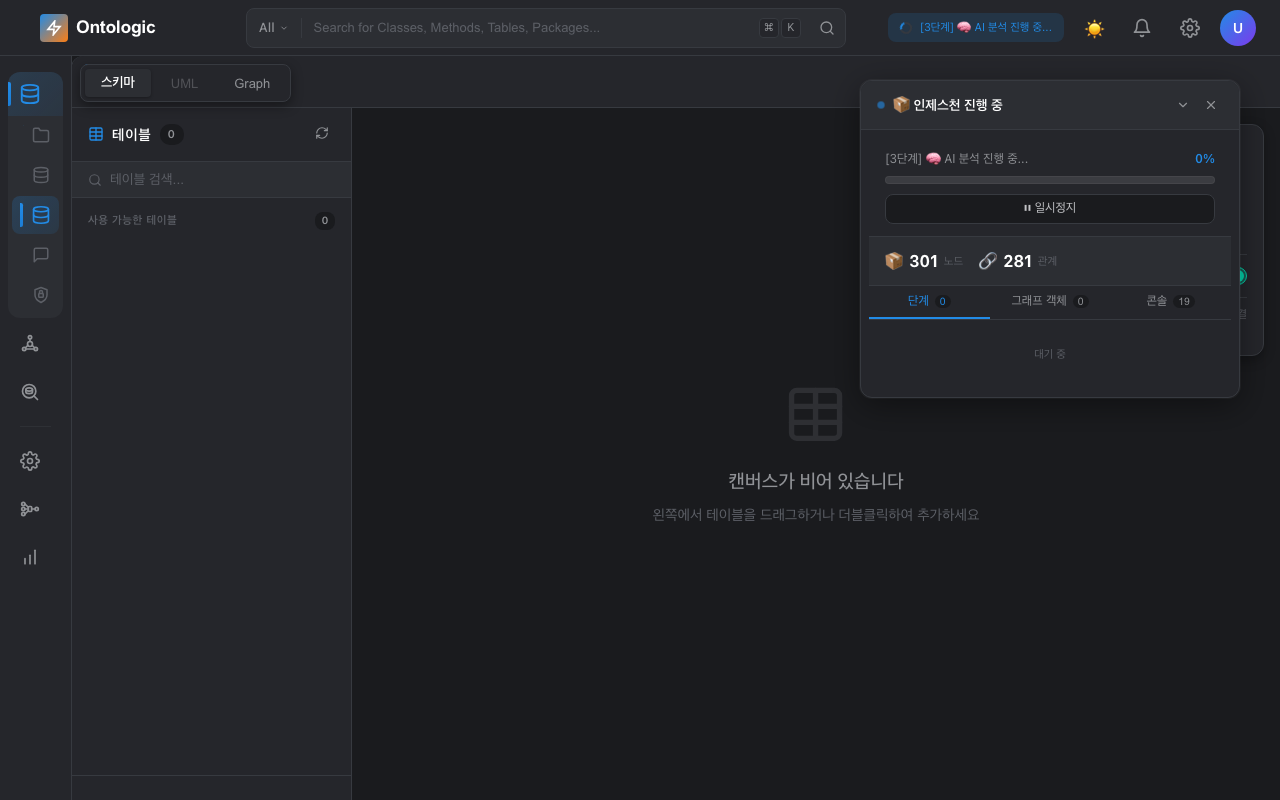
Ingestion in progress: LLM code analysis

Ingestion — Code-Based Metadata Collection

Beyond the schema (DDL), an LLM analyzes legacy code such as stored procedures, functions, and triggers to automatically derive the meaning of tables and columns, the relationships between tables, and code-to-data lineage (WRITES/READS), then loads it all into the knowledge graph.

LLM analysis of DDL + stored procedures
Automatic derivation of table/column relationships and data lineage
Knowledge graph loading and embedding
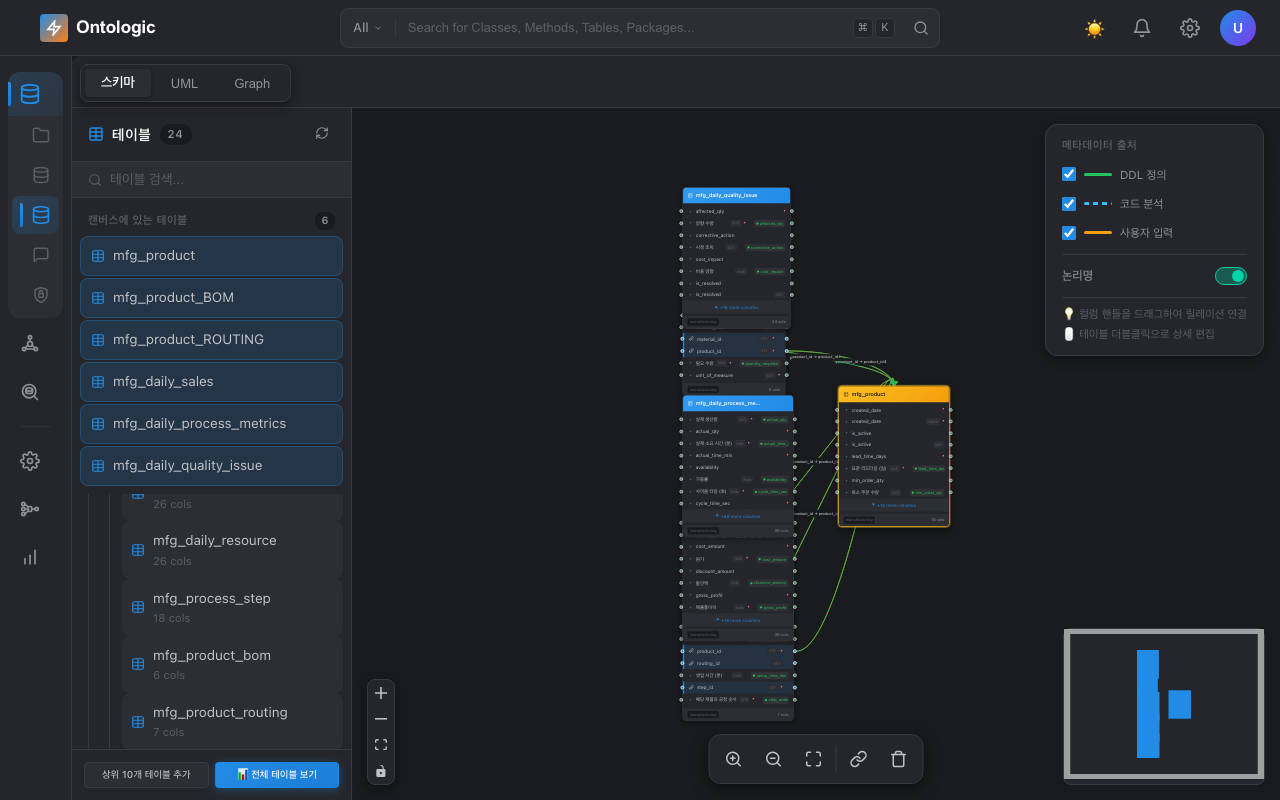
Schema management: ERD canvas

Schema Exploration and Data Lineage

Drag a table onto the canvas and it is laid out as an ERD, showing its real runtime purpose as derived from code analysis rather than from DDL comments. Trace the referencing code for each column to see which procedures read and write it, and when.

Drag & drop ERD canvas
Toggle between logical ↔ physical names
Lineage tracing via column-referencing code
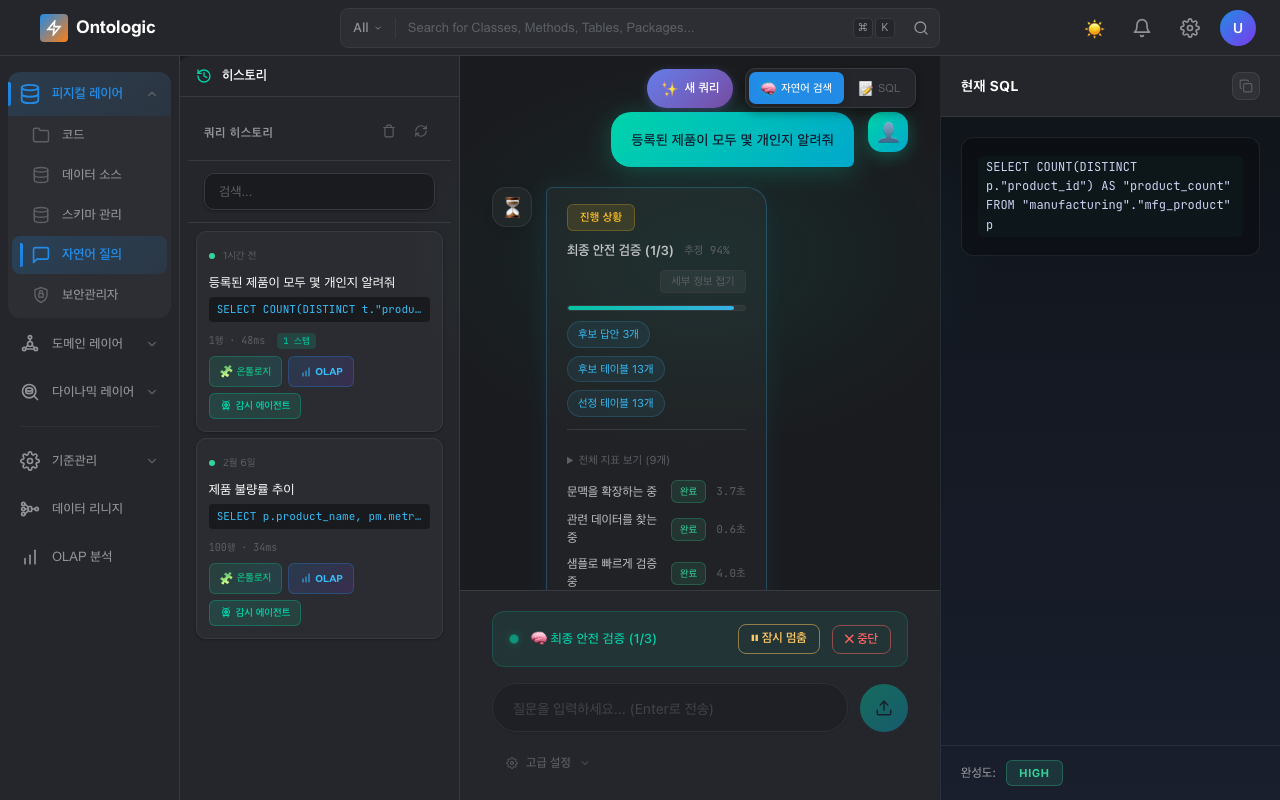
Natural-language query: Text-to-SQL results

Natural-Language Queries (Text-to-SQL)

Type a question and a ReAct agent finds the relevant tables in the schema graph, generates and evaluates multiple candidate SQL statements, and runs the best one. Through the data fabric, federated queries spanning multiple data sources are also possible.

Candidate query evaluation by a ReAct agent
Full transparency into the executed SQL
Federated queries across multiple data sources
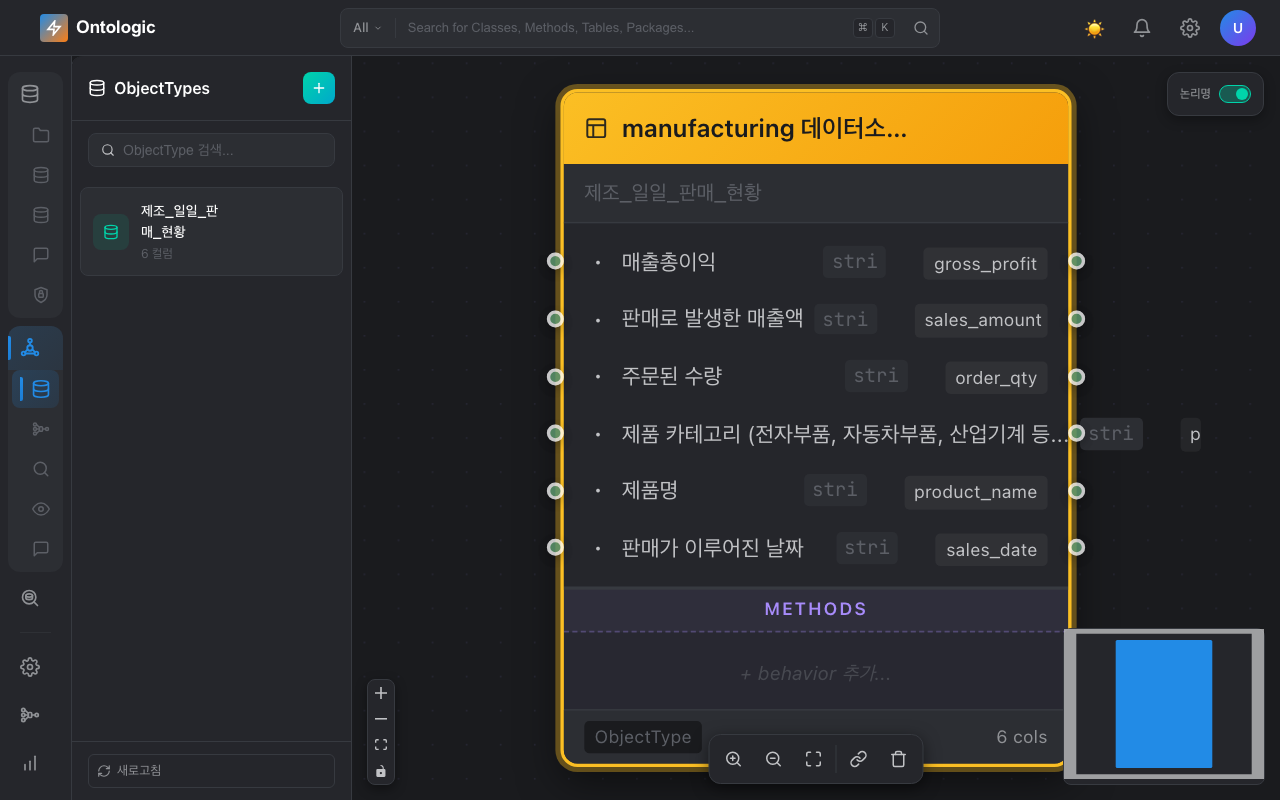
ObjectType card: daily manufacturing sales status

ObjectType — Semantic Layer Objects

Promote a complex join query built from a natural-language question into a single object in the virtual semantic layer. It is created as a View in the data fabric and reused like any other table, and an LLM automatically documents the meaning of each column.

Three-step creation wizard (source → SQL → settings)
Automatic View creation with data synchronization
Automatic LLM descriptions of column meaning
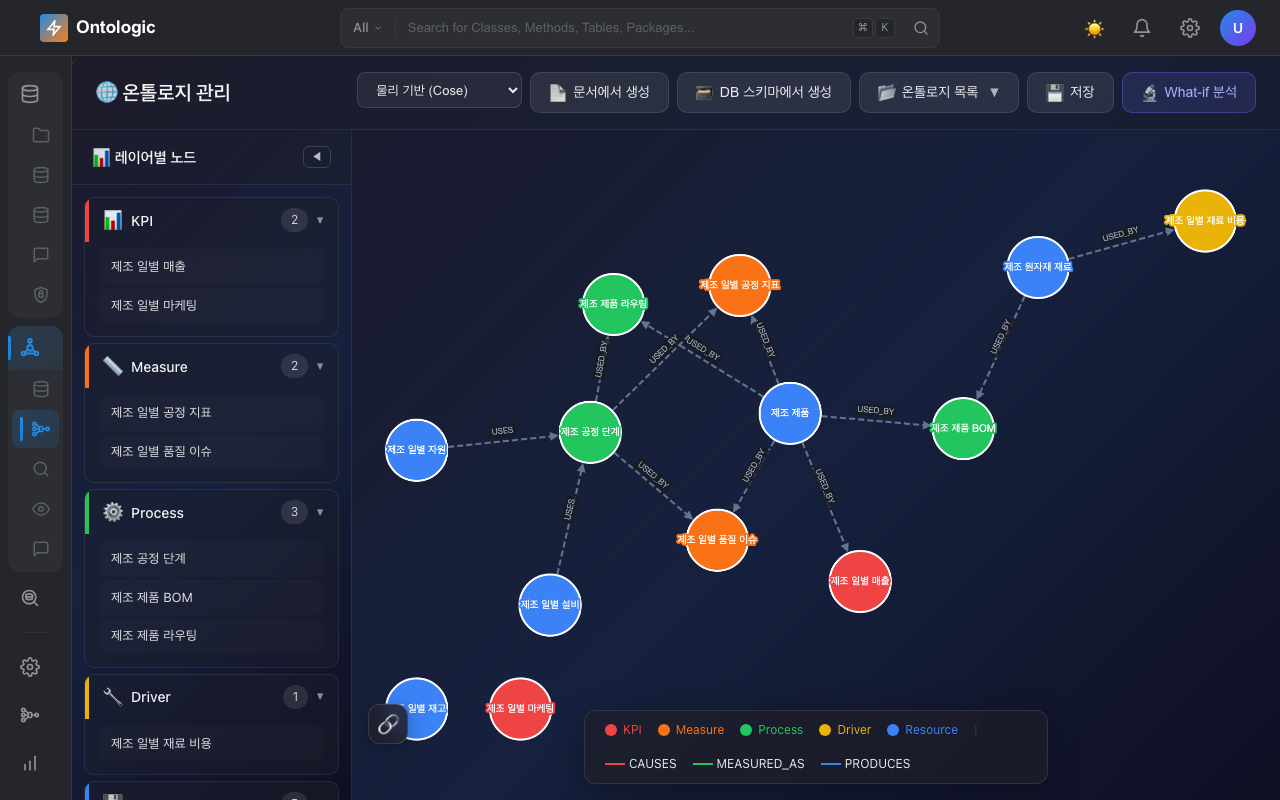
Manufacturing ontology graph: KPI/Measure/Process/Driver/Resource

Ontology Construction

From documents such as operations manuals or from DB schemas, an agent sequentially extracts a five-layer knowledge model of KPI, Measure, Process, Driver, and Resource. Even causal relationships, such as "the quality inspection process produces scrap quantity and defect rate," are derived automatically from the documents.

Automatic generation from documents / DB schemas
Five layers: KPI · Measure · Process · Driver · Resource
Automatic inference of CAUSES · MEASURED_AS · PRODUCES relationships
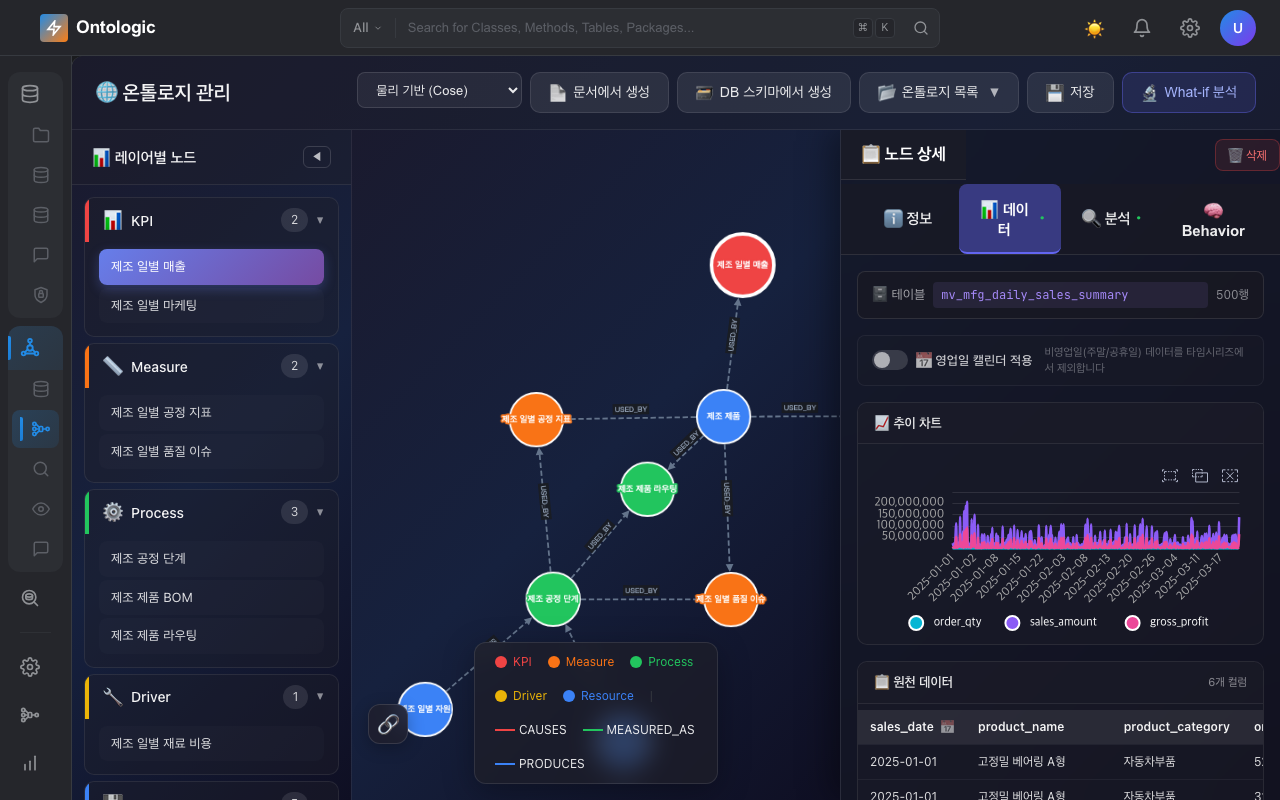
Node data tab: trend chart and source data

Data Mapping and Root-Cause Analysis

Link a physical table or ObjectType to a Measure/KPI node in the ontology and a real-time trend chart is attached. To explain why a KPI landed at a given value, VAR/Granger causality analysis follows the ontology graph and delivers a report of candidate causes and their impact.

Link tables/ObjectTypes ↔ ontology nodes
Real-time KPI trend charts
VAR/Granger-based root-cause analysis reports
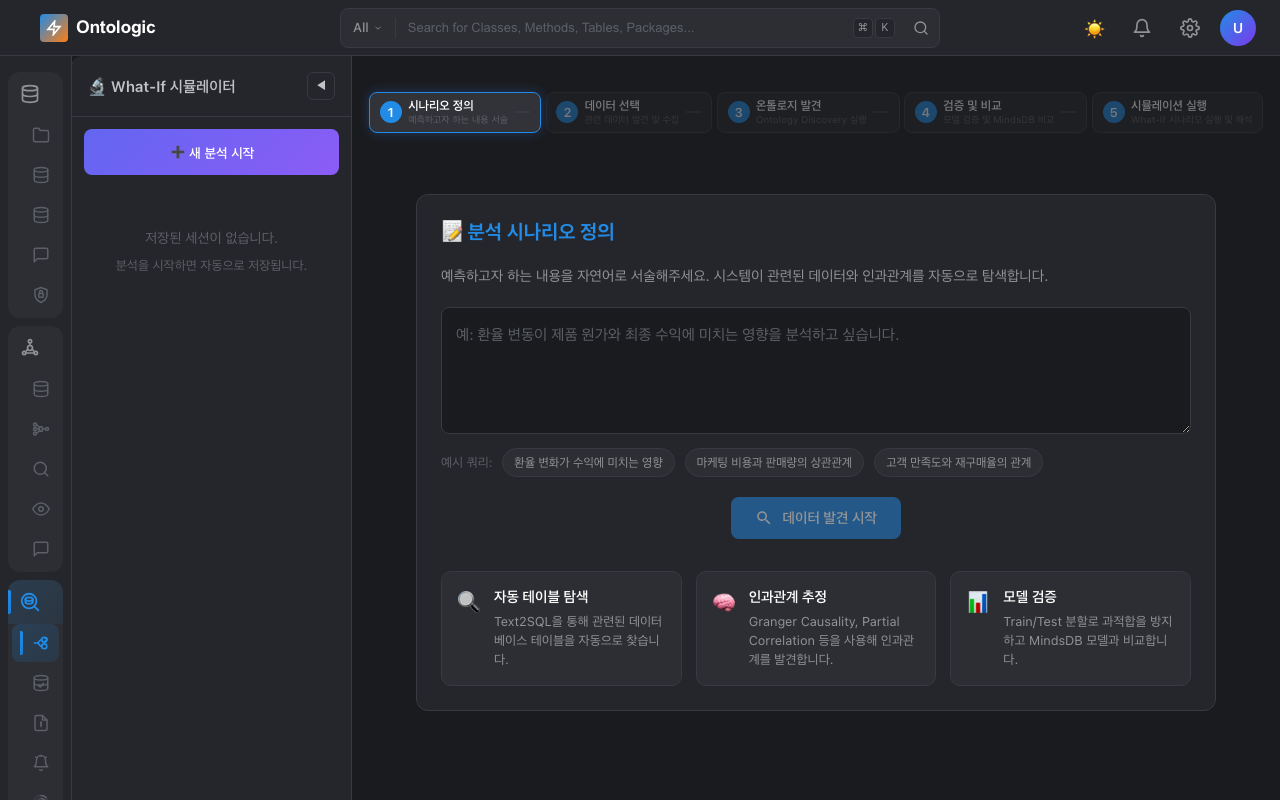
What-If simulator: scenario definition

What-if Predictive Simulation

Predict "what happens in the future if I change this variable" in five steps: scenario definition → data selection → ontology discovery → validation/comparison → simulation run. Only model chains validated by Train/Test backtesting are used in the simulation.

Automatic relationship discovery based on Granger causality
MindsDB AutoML model chain training
Lagged scenario forecasts for Day+1 · Day+2 · Day+3
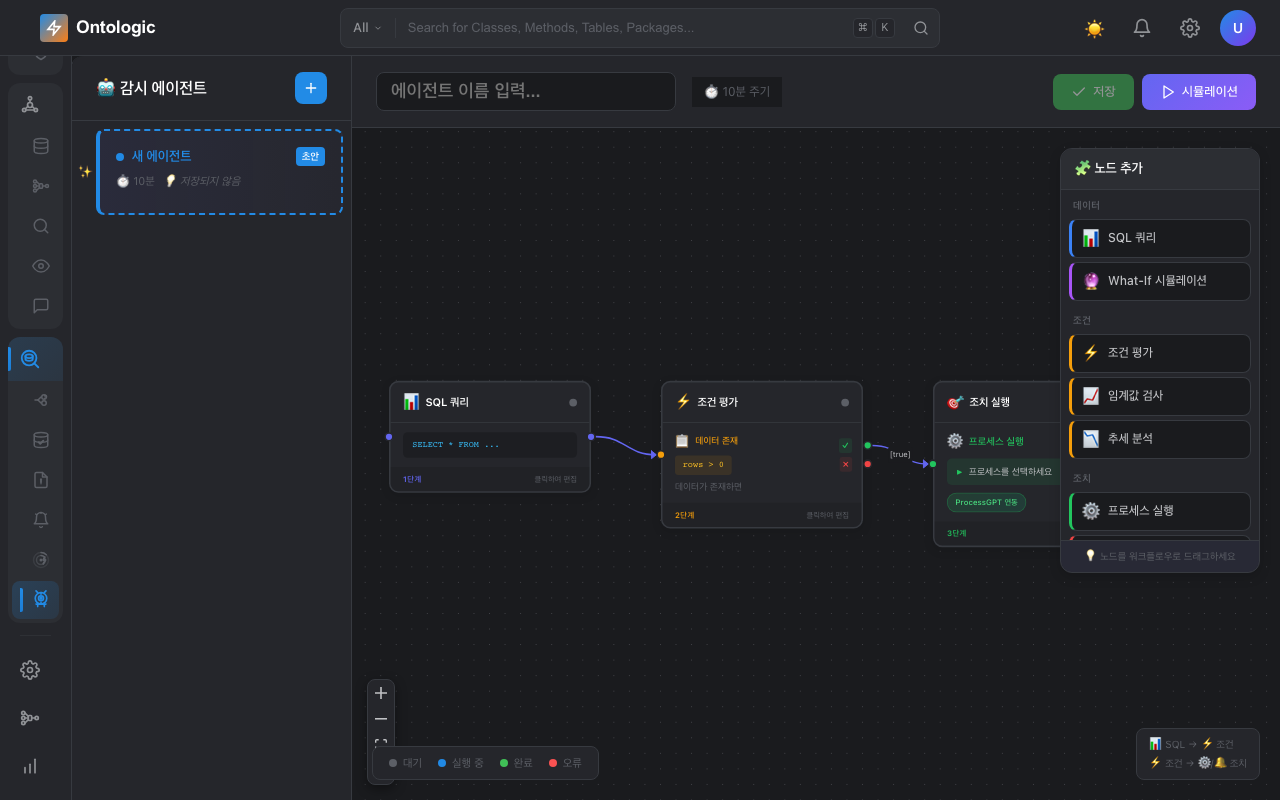
Watch agent canvas

Watch Agent

Design a three-step flow on a node canvas: data source node (SQL query or What-if simulation) → condition evaluation → action execution (ProcessGPT integration). It monitors on a schedule and automatically launches a preemptive action process when a threshold is crossed.

SQL / What-if simulation as watched data sources
Threshold and trend-detection condition evaluation
Automatic preemptive action via ProcessGPT integration

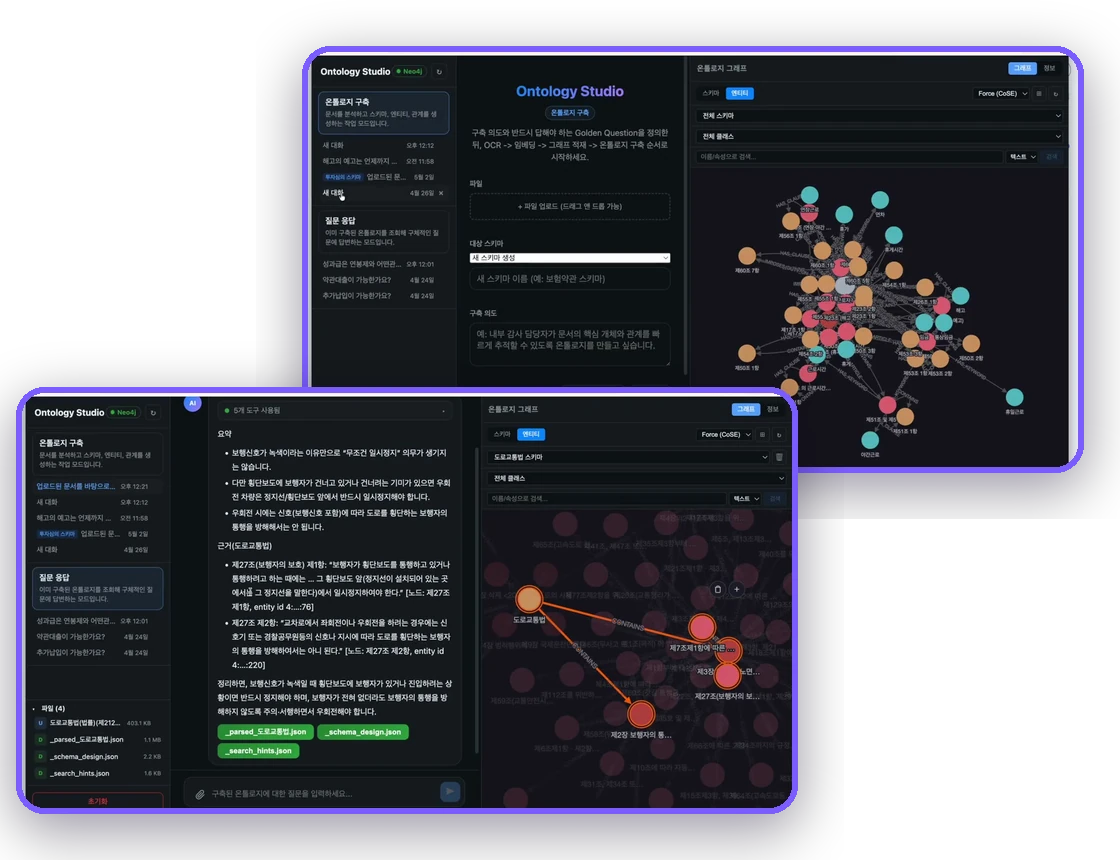
Ontology Studio knowledge graph

Relationship with Ontology Studio

From documents to ontology, from ontology to platform

Where Ontology Studio is an open-source tool that extracts an ontology schema, entities, and relationships from documents and loads them into a Neo4j graph, Ontologic is an enterprise data intelligence platform that connects that ontology to real databases and legacy code and runs natural-language queries, root-cause analysis, What-if, and watch automation on top of it.

Ontologic's ontology construction screen supports document-based generation, which follows the same trajectory as the knowledge graph construction methodology Ontology Studio has built up. Both products share the same goal: making an organization's tacit knowledge explicit as a graph, turning it into a knowledge graph that AI agents can consult.
Shared document-based ontology generation methodology
Ontologic connects the ontology to live data, analysis, and automation
Both products integrate with AI agents via a knowledge graph (Neo4j)

Watch agent canvas: Process GPT action execution integration

Integration with Process GPT

Decisions in the ontology, execution in Process GPT

A watch agent continuously evaluates conditions via SQL or What-if simulation, and when a threshold is crossed, the action execution step delegates execution to Process GPT. Process GPT receives the signal and actually launches the predefined business process, so “decision → action” runs as one continuous flow with no human intervention required.

Process nodes in the ontology are also visualized and edited as BPMN diagrams through process-gpt-bpmn-extractor, and processes defined this way are reused by both What-if simulations and watch agents. If Ontologic is the brain that decides “when and why” action is needed, Process GPT is the hands that turn that decision into real work.
Automatic delegation of the action process when a watch-agent condition is met
Two-way editing between ontology Process nodes ↔ BPMN diagrams
Preemptive process execution triggered by What-if prediction results

Ingestion in progress: Robo Analyzer-family legacy code analysis

Integration with Robo Analyzer

The ontology is only complete once the legacy code has been read

Even a well-maintained DB schema rarely reveals what a table is really for. Ontologic's ingestion engine uses an LLM to analyze legacy code such as stored procedures, functions, and triggers, automatically deriving the meaning of tables and columns and the code–data lineage (WRITES/READS). This legacy code analysis engine uses the same family of reverse-engineering technology as Robo Analyzer.

When ingestion results are not enough — for example, when you need to trace a service's call chain end to end or explore the entire codebase in natural language — you can continue in Robo Analyzer for more precise reverse engineering and feed the results back into Ontologic's ontology.

Automatic meaning derivation via LLM analysis of DDL + stored procedures (same engine family)
Code–data lineage (WRITES/READS) loaded into the graph at ingestion time
Extend to Robo Analyzer when you need more precise call graphs or natural-language search

Comparison Summary

Attribute Ontologic Platform Traditional BI · Data Catalogs
Data integration100+ connectors + legacy code analysisStructured DB-centric, limited connectors
Metadata acquisitionExtracted automatically by an LLM from DDL and proceduresTagged and documented manually by people
Query methodNatural-Language Queries (Text-to-SQL)Fixed dashboards and reports
Semantic layerOntology (KPI · Measure · Process · Driver · Resource)Plain lists of tables and columns
AnalysisRoot-cause analysis (Granger/VAR) + What-if simulationMostly aggregation of historical data
AutomationWatch agents launch preemptive action processesStops at alerts and report generation

Get started today!

Unify your scattered enterprise data into a single ontology with Ontologic Platform, and manage everything from queries to prediction and automation in one flow.
Start with the demo video or check out the project on GitHub.


Have more questions?

Want to learn more about Ontologic Platform or have a question? Get in touch anytime.