The Execution Profiler: Inspecting an AI Agent's Execution Path and Cost
When a piece of work takes longer than expected, the total elapsed time alone rarely reveals the cause. You need to see which task was delayed, and which calls were executed within it.
Execution records are also needed when reviewing an AI agent's results. Only by examining the input passed to the model, the tools it called, and the results those tools returned can you understand the processing path and the cause of errors.
Process GPT's Execution Profiler lets you inspect a work execution step by step, down to individual language model and tool calls. You can review processing time, token usage, and cost for each piece of work.
1. Select a work execution to check its time and cost
On the process analysis screen, selecting a row for an instance — that is, a single work execution — opens the Execution Profiler. At the top, the total elapsed time, token usage, and cost are displayed together.
The waterfall chart below shows activities and tasks as bars in chronological order. You can compare the elapsed time of each segment by bar length and locate the tasks that need a closer look.
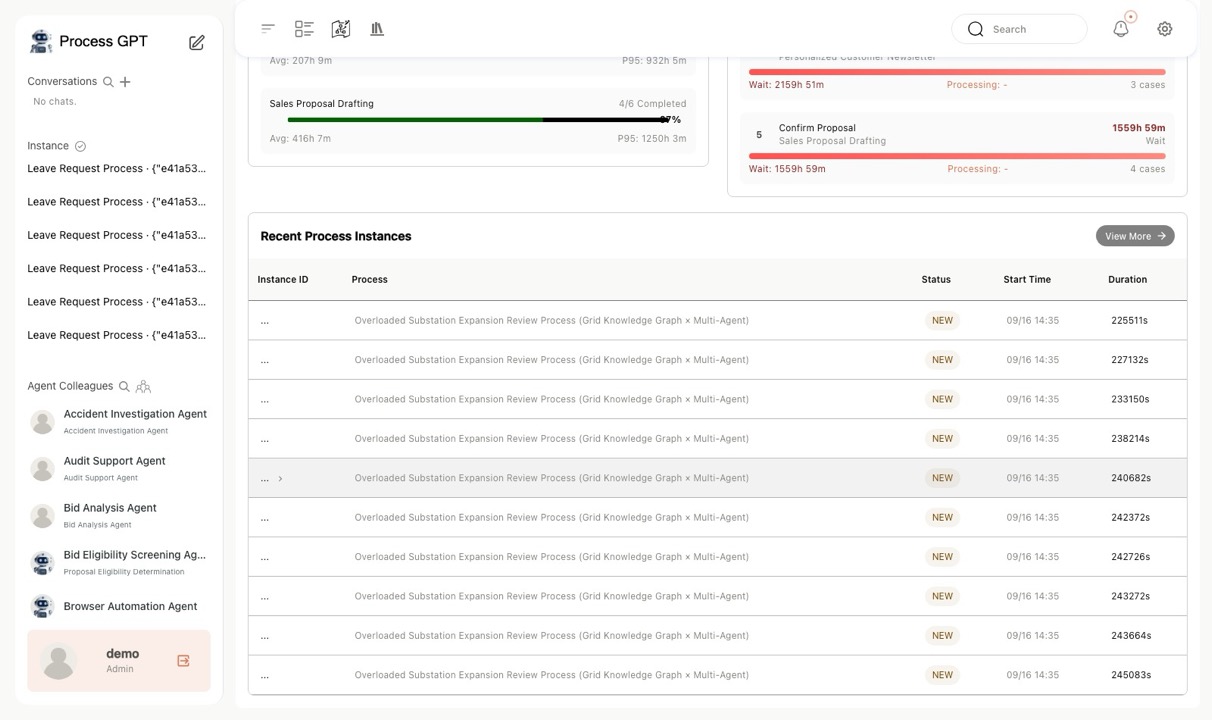
Select the execution you want to examine in detail from the process analysis list.
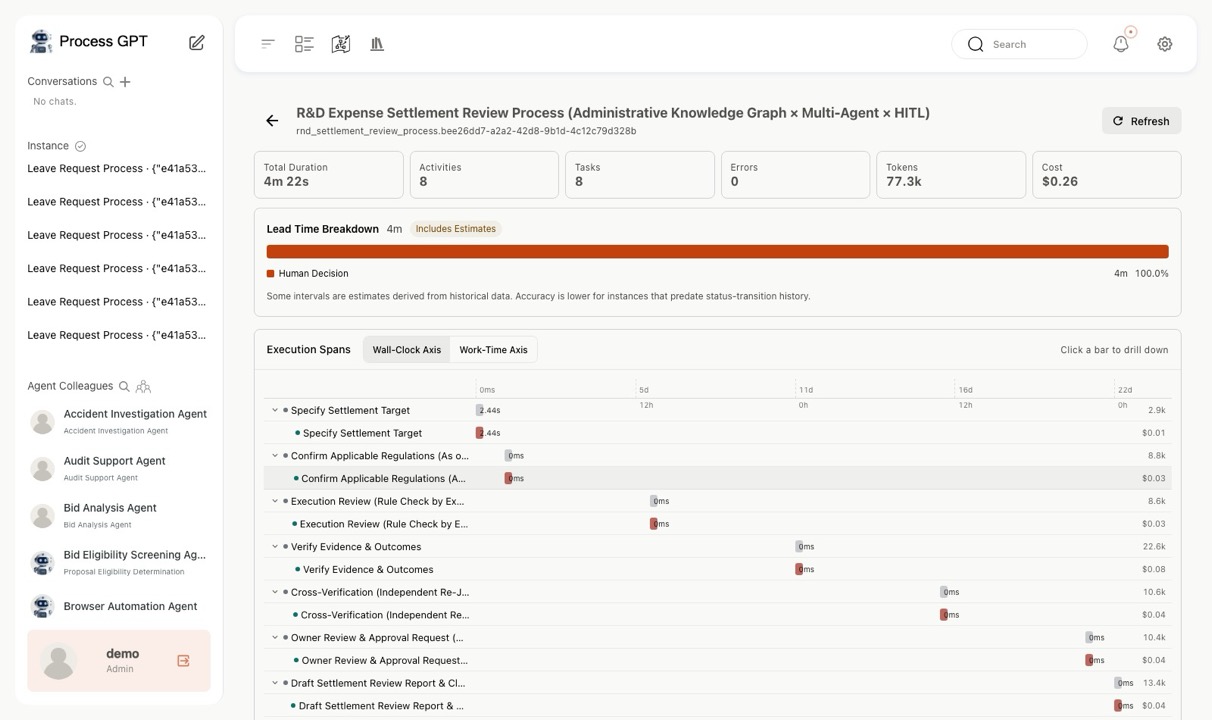
The demo screen shows a total elapsed time of 4 min 22 s, 77.3k tokens used, and a cost of $0.26. The chart below shows the execution span of each task.
2. Trace from the task down to language model and tool calls
Related records are viewed in order: process instance → task → language model call → tool call.
Select a task bar to expand the language model calls made in that task. Beneath each language model call, the records of the tool calls it requested are linked.
These links are built from the spans — the trace records of individual calls collected during execution. Because a trace record is created for each language model request and the related tool calls are attached to it, you can see exactly which request invoked which tool.
What the call detail view shows
- Overview: the model used, elapsed time, input and output token counts, and cost.
- Prompt tab: the messages actually sent to the model — system prompt, user instructions, and so on — broken down by role.
- Response tab: the body returned by the model, plus the name and input arguments of any tool it requested.
- Tool span: the input passed to the tool and the result it returned. Auth tokens and passwords are masked at storage time.
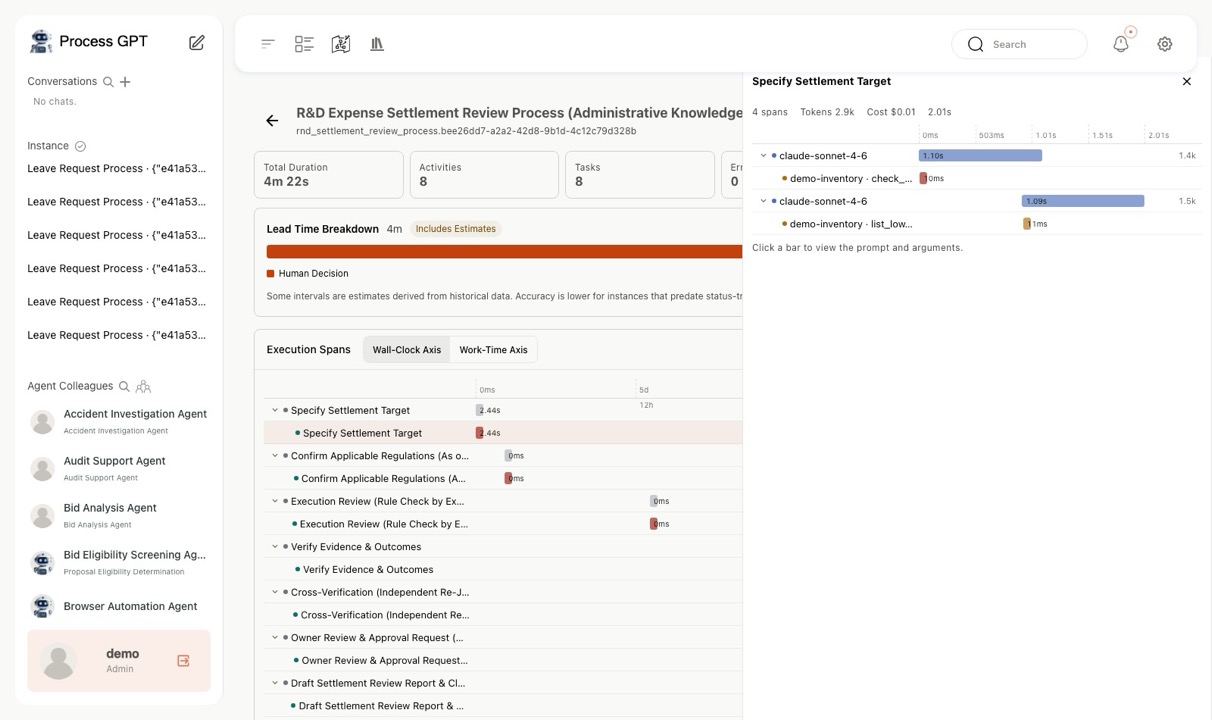
Expanding a task displays its language model calls and the related tool calls as a hierarchy.
▶ Language model span — model, time, token cost
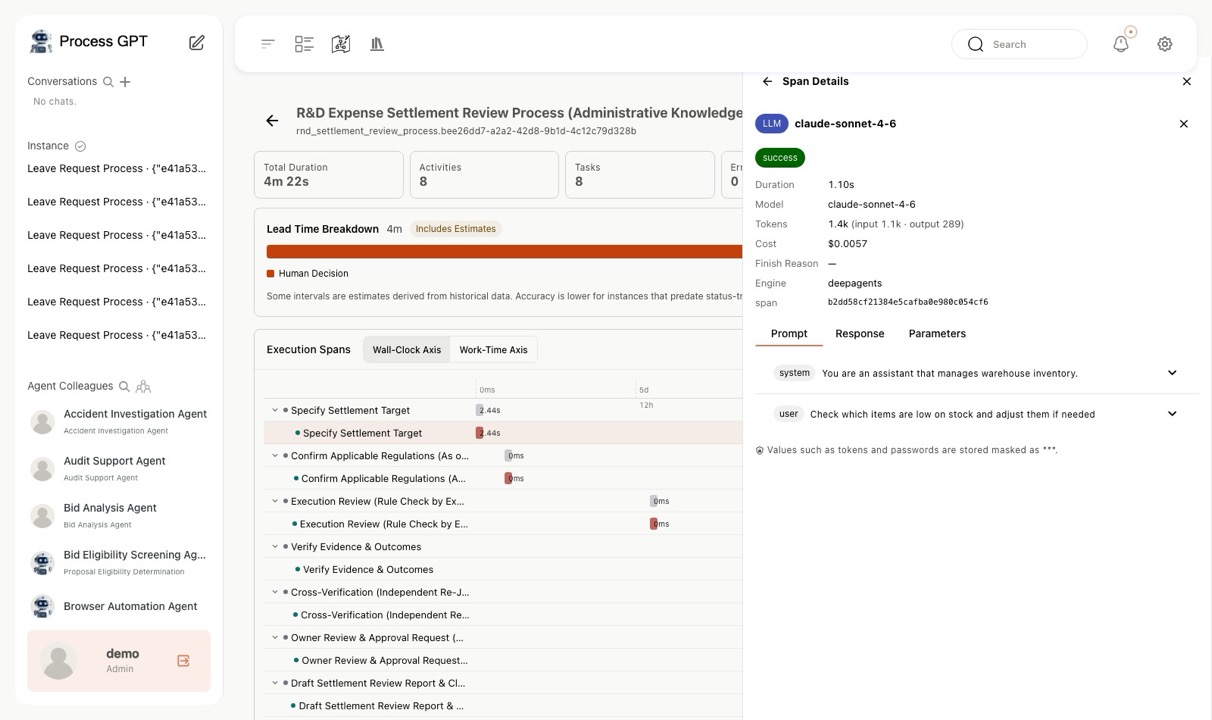
View the model name, elapsed time, input and output tokens, and cost of each individual language model call. In the demo, this call shows $0.0057.
▶ Prompt tab: messages sent to the model
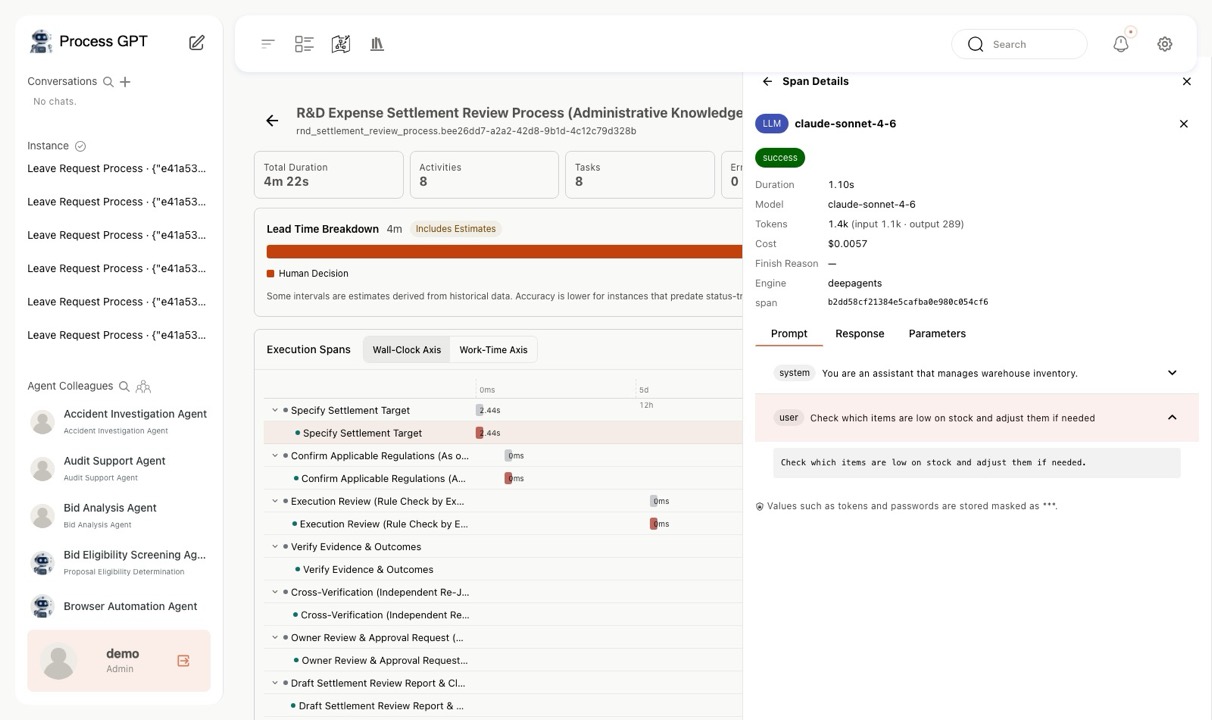
Review every message sent to the model, from the system prompt to the last user instruction, broken down by role.
▶ Response tab — the tool and arguments the model requested
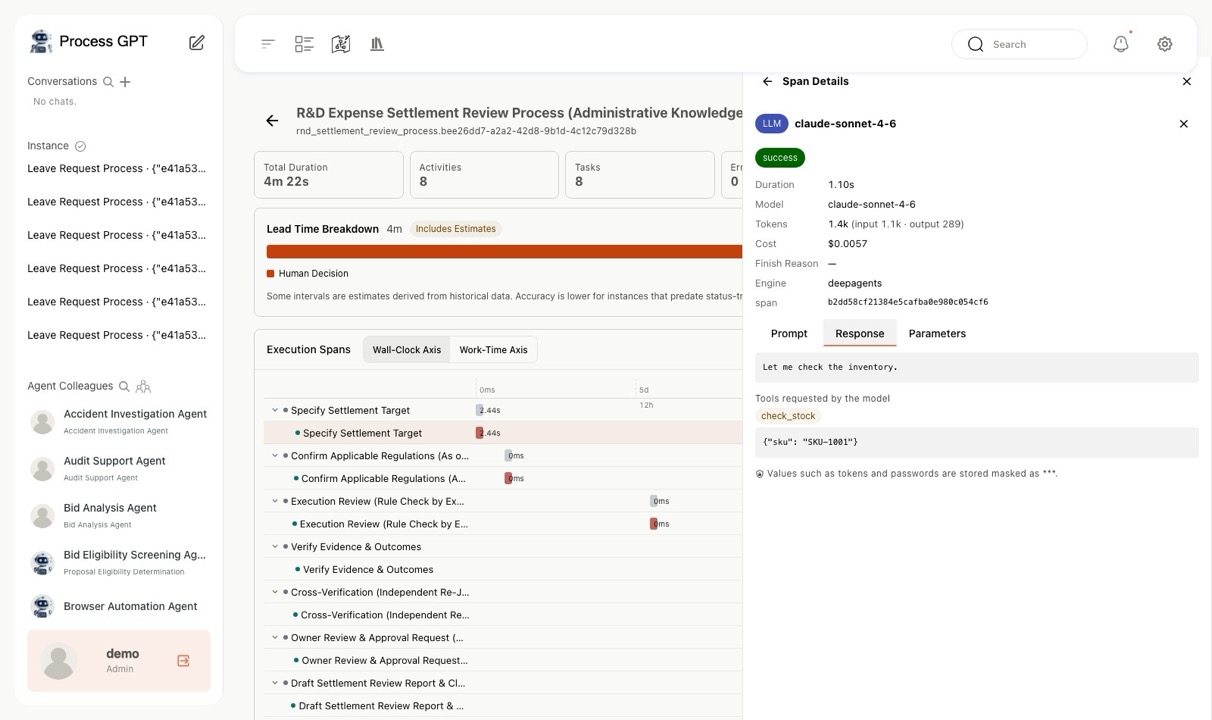
View the model's response body together with the requested tool name and input arguments.
▶ Tool span: input, returned result, errors
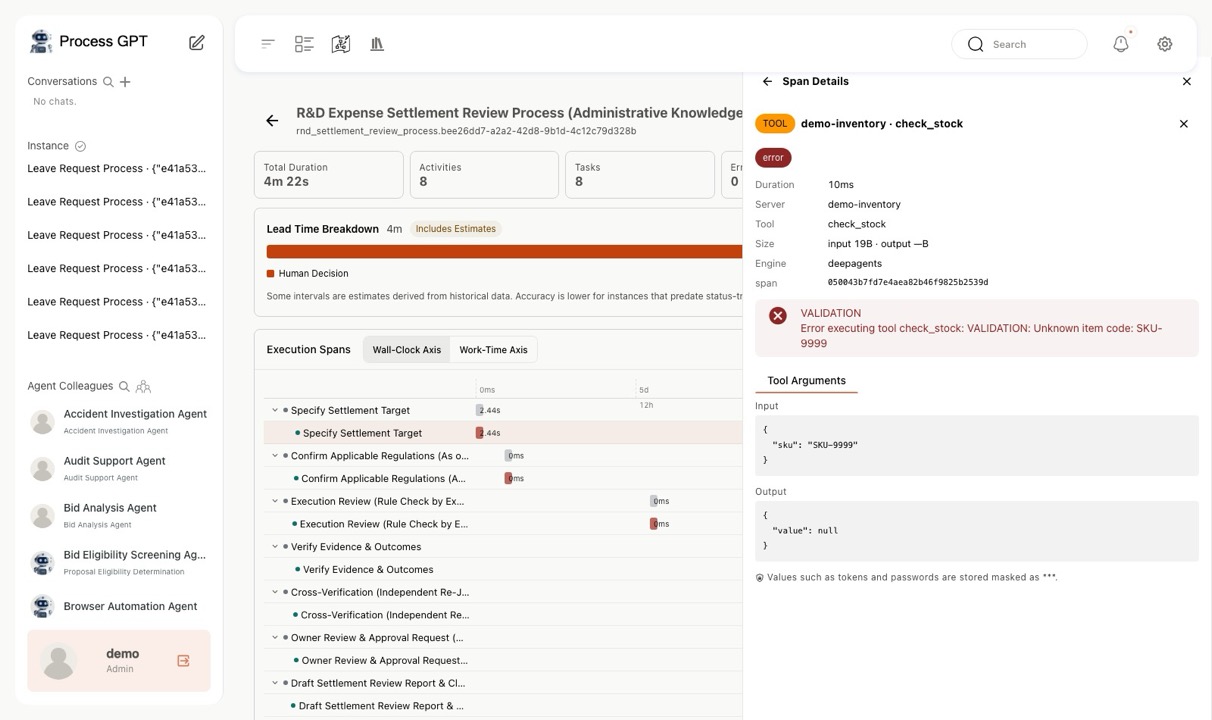
View the tool's input, returned result, and error details. In the demo, a lookup of a nonexistent SKU produced a VALIDATION error.
3. Show whether the execution engine supports detailed tracing
The trace information available depends on the execution engine. For engines that do not support detailed tracing, the supported scope is shown so you can tell whether a record is missing or the feature is simply not supported.
Distinguishing unsupported information from uncollected information lets operators understand what can be verified instead of spending time investigating errors that are not there.
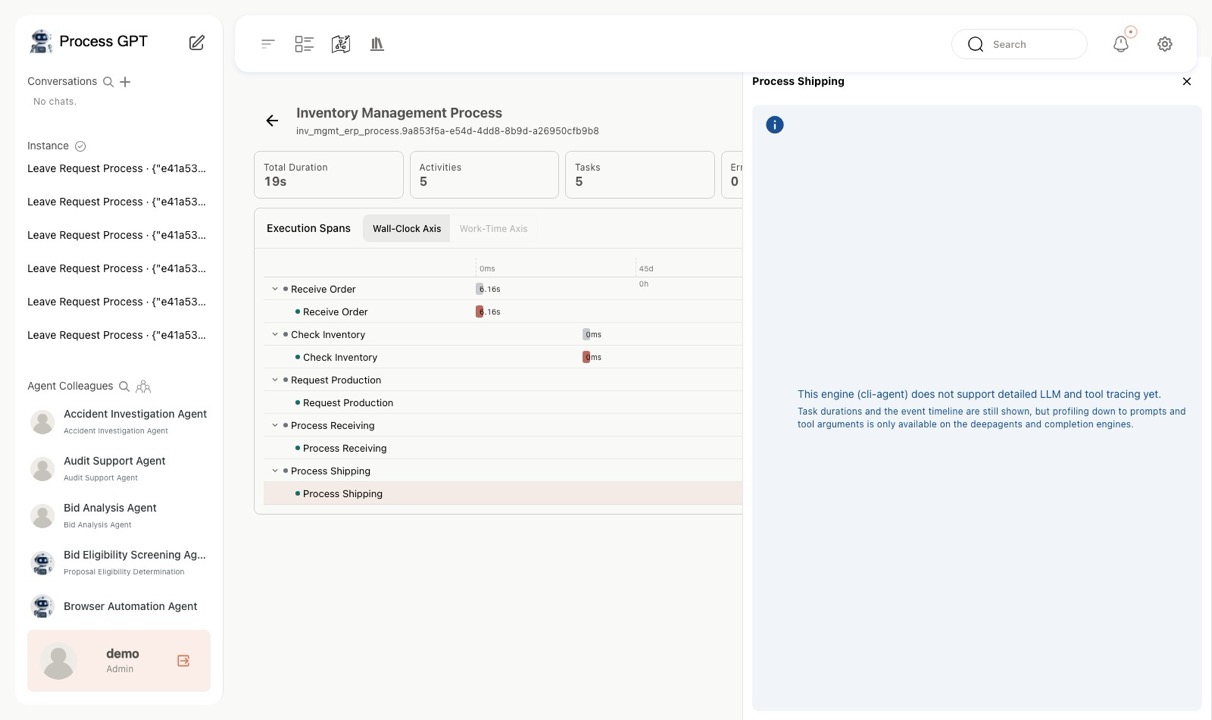
For engines without detailed tracing support, a notice reads: ‘This engine does not provide detailed LLM call information.’
4. Manage call records alongside business information
The Execution Profiler uses information collected from the LLM proxy and event logs. These records are linked to process instances and work items so they can be viewed from the existing business analysis screens.
Staff can open the record for a given execution directly, with no need to cross-reference trace IDs against business numbers in a separate screen. Stored raw content has sensitive values masked and is purged automatically once the retention period expires.
| What to check in operation | How the Execution Profiler is delivered |
|---|---|
| Linking call records to work | Trace records attached to process instances and work items |
| How to reach the detailed record | Select an execution from the process analysis list |
| Trace data collection path | Uses the existing LLM proxy and event logs |
5. Use it for result review and cost analysis
To put agents to work on real business tasks, staff must be able to review what they produced. The Execution Profiler provides the inputs, outputs, and tool call records that review requires.
Seeing which prompt was sent, which values went into which tool, and what came back lets you investigate the cause of an error or verify the basis for a result. These records are the actual messages exchanged and actions executed — not the model's internal reasoning.
Per-execution token usage and cost can feed into analysis of automation operating expenses. Note that the token cost shown on screen is only part of the total cost of the work; infrastructure and external service costs must be considered separately.
See it in Process GPT
| Concept in this article | Process GPT capability |
|---|---|
| Tracing agent inputs, outputs, and tool calls | Span instrumentation across the multi-agent execution layers ↗ View on the product page |
| Linking execution records to the relevant work | BPMN-based linkage to process instances and work items ↗ View on the product page |
The Execution Profiler is covered together with the full feature set on the Process GPT product page, and you can try it yourself at process-gpt.io.