How to Analyze AI Agent Tool Usage and Errors
When improving a process, you usually look at how long each task takes and how much each person handles. Once AI agents start doing the work, one more question is needed: where and how often are the agents' tools being called, and under what circumstances do they fail?
Linking tool call records to processes, departments, and execution engines lets you examine usage and error patterns together. In this article, tools are referred to as "tools" to match the naming in the product UI.
Tool Analysis in Process GPT provides this information under the Process Analysis menu. We will walk through it in order: confirm the scope of the data being analyzed, compare usage in a cross-tab, and then find the points that need improvement.
1. Confirm the scope of data included in the analysis
The Tool Analysis screen first shows how well the call records are linked to business information. Of the 243 tool calls in the demo, it displays the share for which the process can be identified and the share for which the using department can also be identified.
If some calls lack process or department information, the analysis may not reflect overall usage. So before interpreting the numbers, check how far the data is linked.
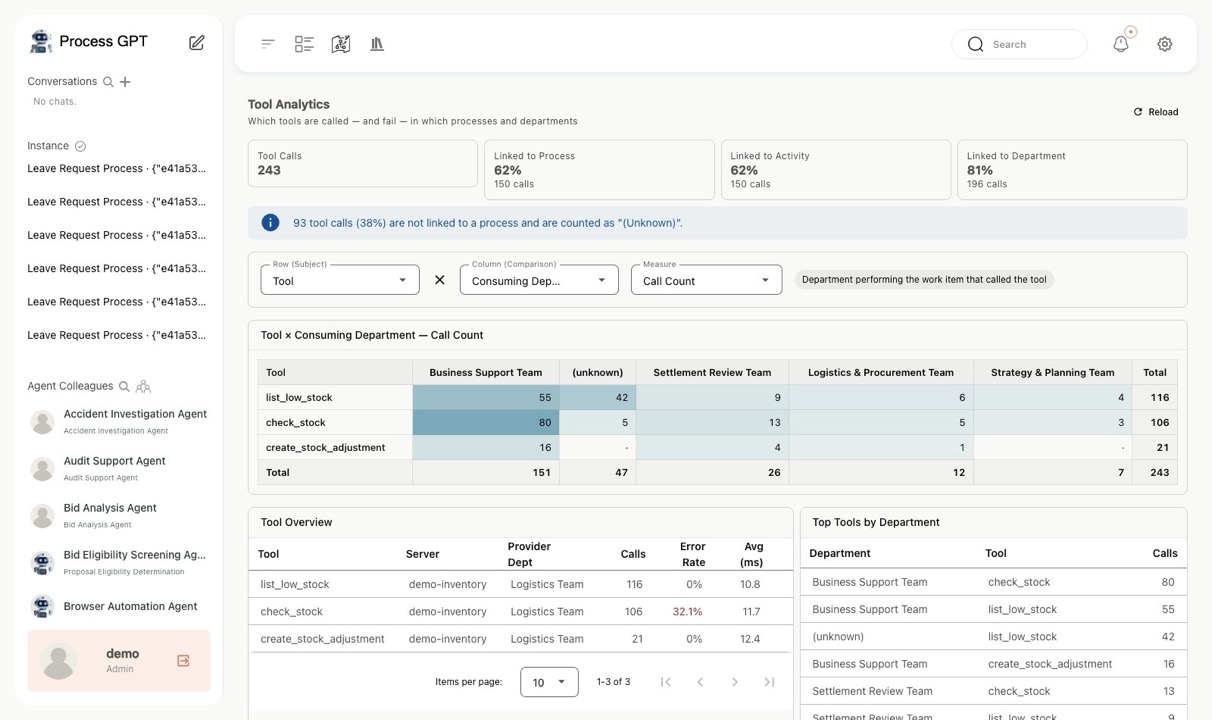
It first displays the share of all calls for which the process and the using department can be identified.
2. Compare usage by department, process, and execution engine
The default cross-tab shows tools in the rows and using departments in the columns. The darker the color, the more calls. In the demo, you can see that the inventory lookup tool is used heavily by the Business Support team.
By changing the column dimension and the measure, you can compare the following.
- By process: see which tasks use the same tool. In the demo, the inventory management and settlement review processes share the same tools.
- By execution engine: compare which tools the deep agent and the completion CLI agent each call. This reveals usage patterns by execution engine.
- By failure rate: display the failure rate instead of the call count to find the combinations where errors concentrate. In the demo, failures of the inventory check tool are concentrated in the inventory management process.
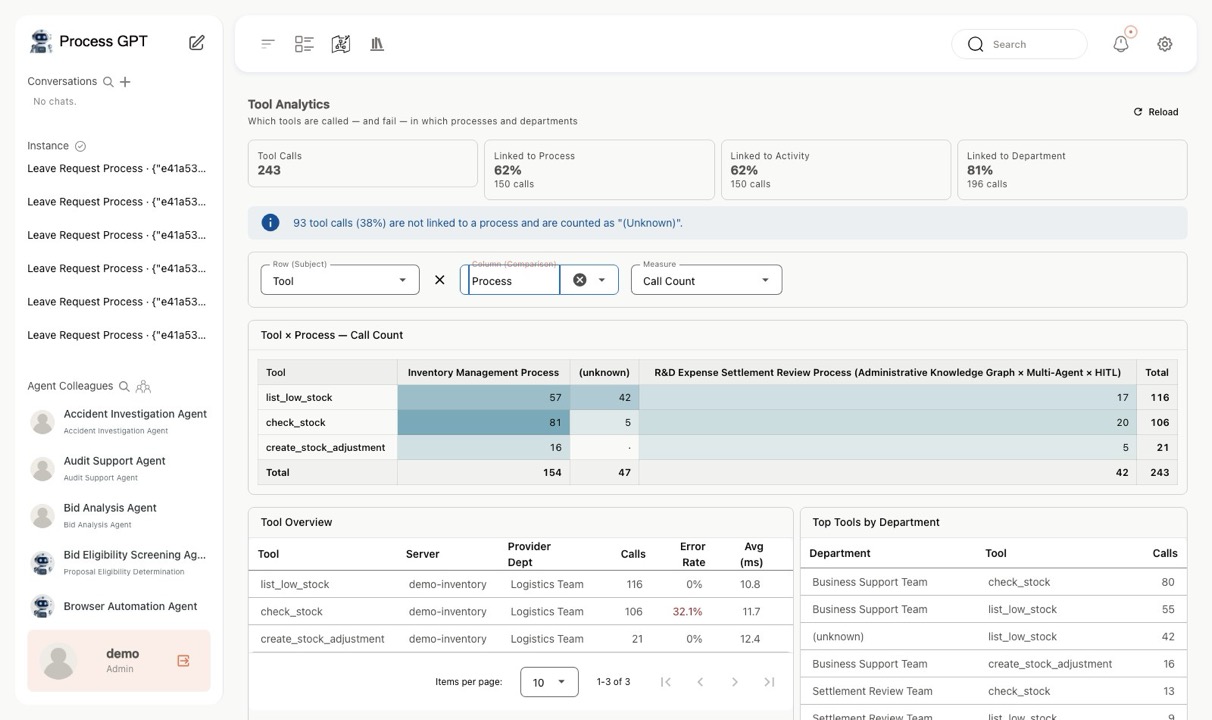
Switch the cross-tab columns between department, process, and execution engine to compare tool usage.
▶ Comparison by process: tasks that use the same tool
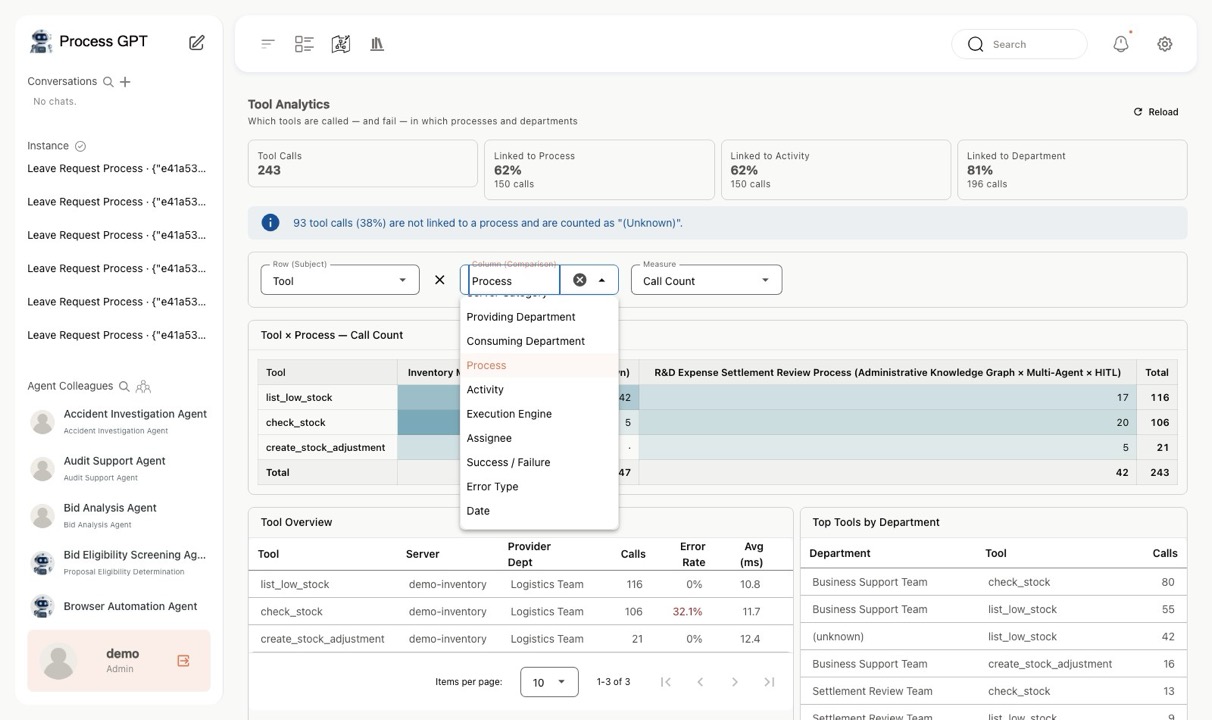
Viewed by process, you can see that the inventory management and settlement review tasks use the same tools.
▶ Comparison by failure rate: where errors concentrate
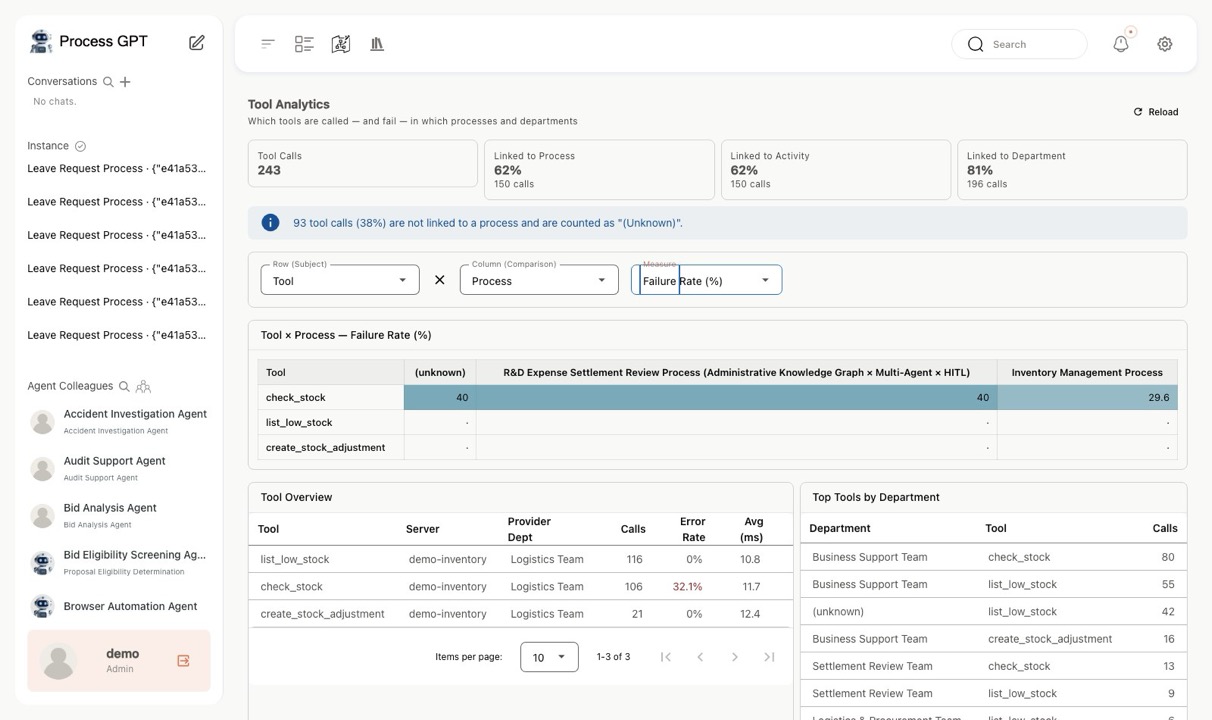
Selecting failure rate shows the combinations where errors concentrate. Because failure rates cannot simply be summed, no totals row is displayed.
3. Failure rates and average response times are not simply summed
When you switch the measure to failure rate, the totals row disappears. This is by design, so that a simple sum of the rates is not mistaken for the overall failure rate.
Since each cell has a different number of calls, adding up the failure rates does not give the overall failure rate. You have to divide the total number of failures by the total number of calls. Average response time cannot simply be summed either, so this screen provides no totals row.
Call counts, rates, and averages are aggregated differently. Displaying each according to its nature is what makes the analysis results interpretable.
4. Distinguish the department that provides a tool from the departments that use it
In the per-tool overview below the cross-tab, you can see the providing MCP server, the registering department, the failure rate, the average response time, and the number of processes using the tool.
On the right, the highest-volume department and tool combinations are shown. Here, the department that provides a tool and the departments that actually use it are distinguished. For example, an inventory tool registered by the Logistics team may be used most by the Business Support team. Seeing both together helps the operating department decide which using departments to consult about improvements.
To support this, we added classification criteria for MCP tools and servers and a tool usage aggregation structure to the data warehouse. Servers are organized so you can drill down from category to providing department to individual server.
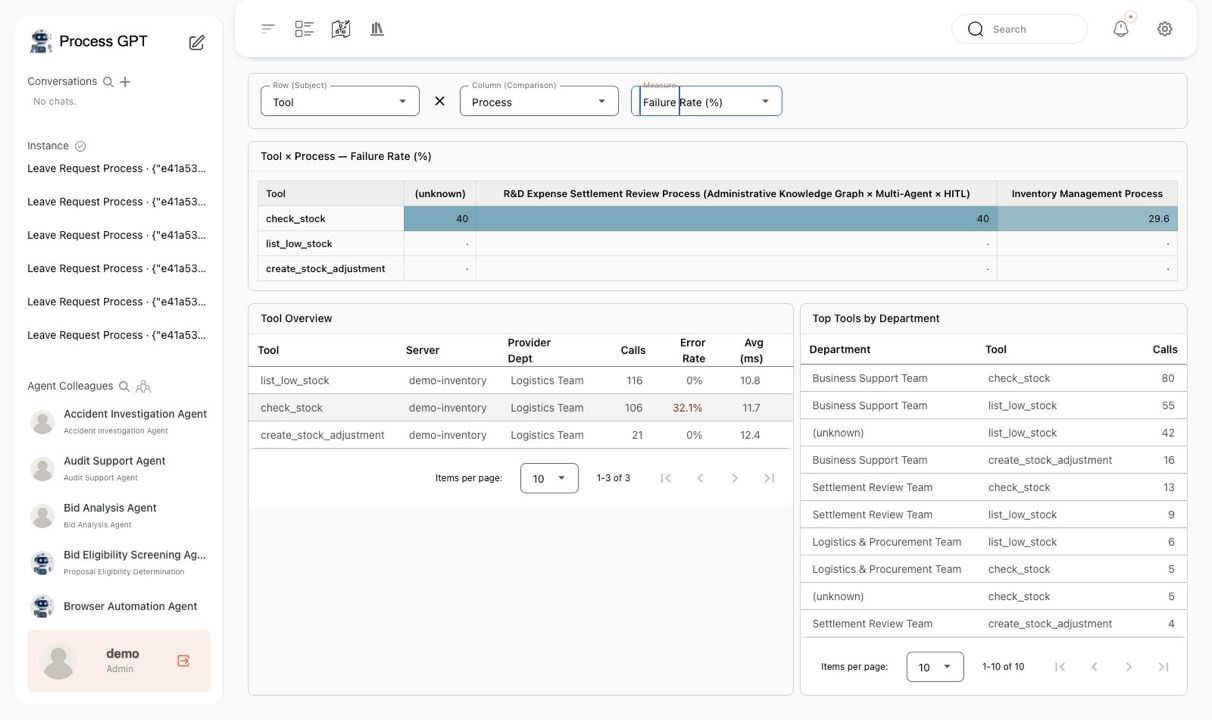
Per-tool operational metrics and the highest-volume department and tool combinations are shown together. Providing and using departments are kept separate.
5. We filled in business information missing from the call records
To provide analysis by process and department, the call records must be linked to that information. During development, we fixed the following two gaps. The figures below are based on the data reviewed at the time.
- Missing process links: some tool call logs had no instance ID. By tracing the link through work items, we increased the number of calls with an identifiable process from 90 to 150.
- Missing department updates: the department field was empty for all 295 work items reviewed. The department column had been left out of the update routine, so organizational information confirmed later was never reflected in existing records. We fixed this.
The accuracy of the analysis screen depends on how well the raw records are linked to business information. Alongside building the charts, we had to examine the missing data and the update logic.
6. Decide what to improve based on usage and error patterns
Tool Analysis lets you compare usage and failure rates by process, department, and execution engine on a single screen. It is useful for seeing which tools are used most and which tasks concentrate errors.
Based on the analysis, you can decide which tools to improve first, which process to investigate for the cause of errors, and which departments to consult. That said, rather than drawing conclusions from the failure rate alone, you should also check the detailed records of the calls in question.
See it in Process GPT
| Concept in this article | Process GPT capability |
|---|---|
| Manage tool calls as an independent subject of analysis | MCP-based multi-agent execution ↗ See the product page |
| Link tool usage records to processes and departments | Execution based on BPMN process instances and work items ↗ See the product page |
| Find failure points and use them for improvement | Self-learning from execution records ↗ See the product page |
Tool Analysis is included in the Process Analysis menu of Process GPT. See it for yourself at process-gpt.io.