Enterprise MCP Hub: From Server Connections to Permissions and Call History
MCP (Model Context Protocol) is the connection protocol AI agents use to call external tools. To operate multiple MCP servers in an enterprise, you need to manage not only connection settings but also server health, access permissions and change history.
Previously, Process GPT stored MCP server information as JSON in per-tenant settings. That approach alone made it hard to verify connection status in advance or to systematically manage the tools offered and the history of configuration changes.
The MCP Hub brings these operational functions together in one place. Through the MCP Servers, Gallery, Observability and Integration Standards menus in the sidebar, you can manage everything from server registration to permission settings and call-history review.
1. Check connection status before registering a server
The server list shows the provider, transport, version and connection status. The '1 healthy / 4 failing' in the demo screen is the aggregated result of periodic connection checks.
Connection test before saving
Before saving a server, test the connection and review the list of available tools. A result such as 'Found 3 tools' lets you see in advance what capabilities the server you are registering provides. Connection validation is performed by the MCP validation service.
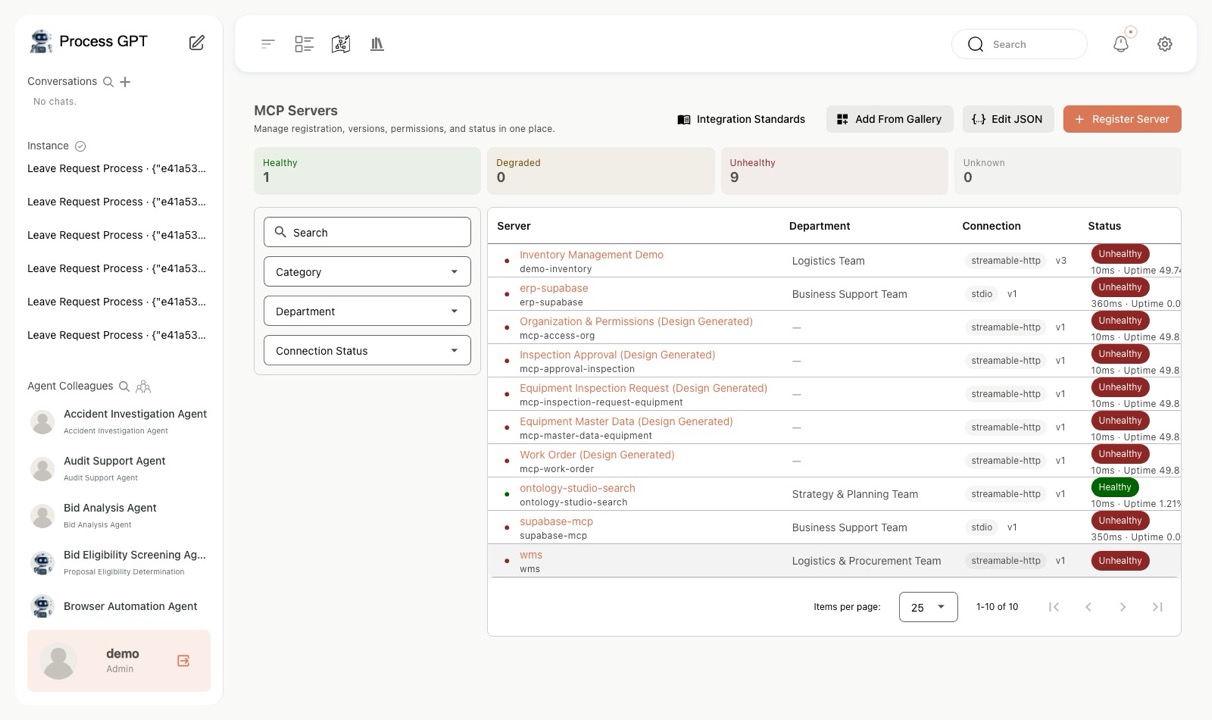
Review connection details and the results of periodic health checks in the server list.
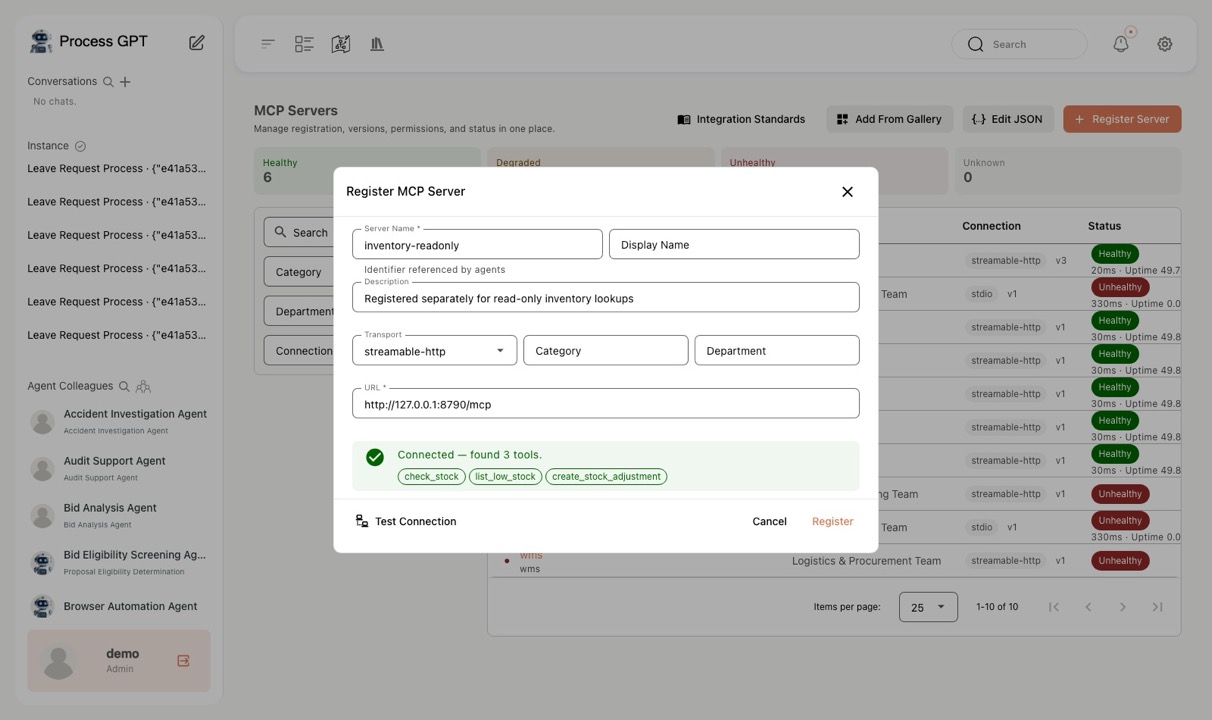
Test the connection and review the available tools before saving a new server.
2. Manage tools, permissions and configuration versions per server
- Status: View connection details, latency, 24-hour availability and consecutive failure count.
- Tool catalog: Stores tool names and input schemas. You can select which capabilities the agent may use at the level of individual tools.
- Version control: Keeps connection settings as versioned snapshots. Changing a setting creates a new version, and if a problem occurs you can roll back to a previous version.
- Access permissions: Set permissions per role, user and agent. Tools that affect operational data, such as inventory changes, can be blocked individually.
- Call history: View the requests sent to the server and the process instance each request originated from.
By selecting tools individually and restricting permissions, you can allow the agent only the capabilities its work requires. It is also useful for managing tools that read data separately from those that modify it.
▶ Status — latency, 24-hour availability, consecutive failures
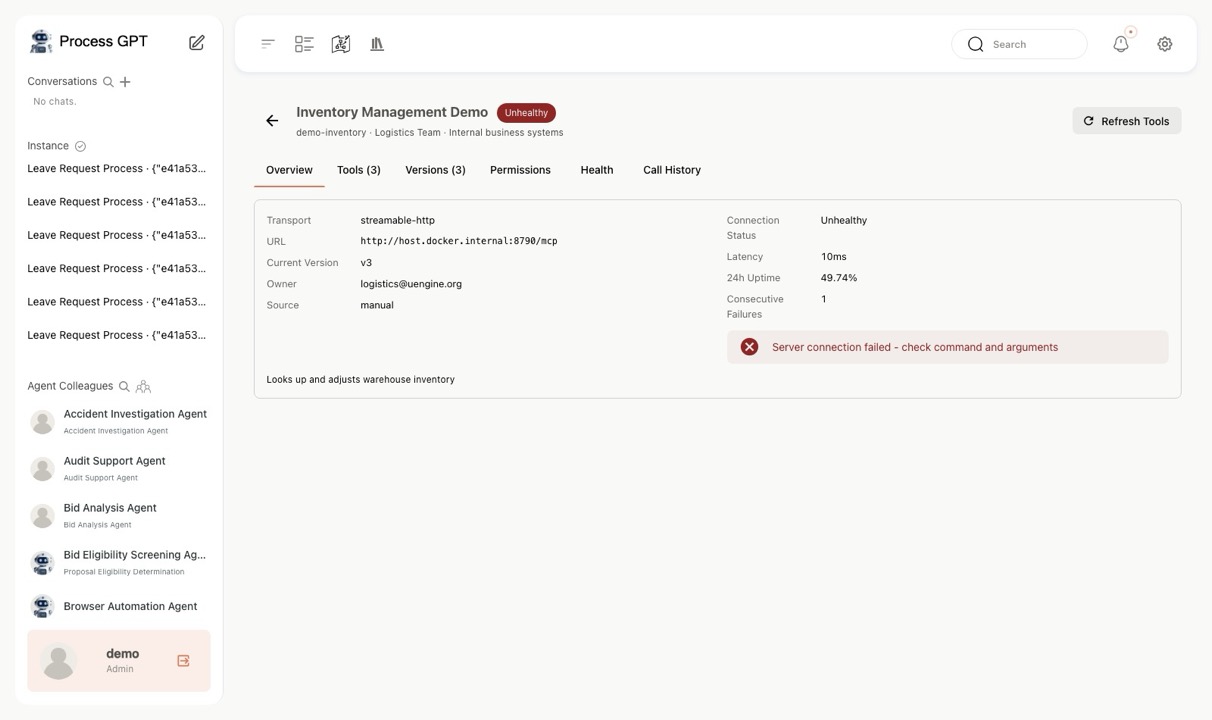
View latency, 24-hour availability and consecutive failure count on the server detail screen.
▶ Tool catalog — input schemas stored too
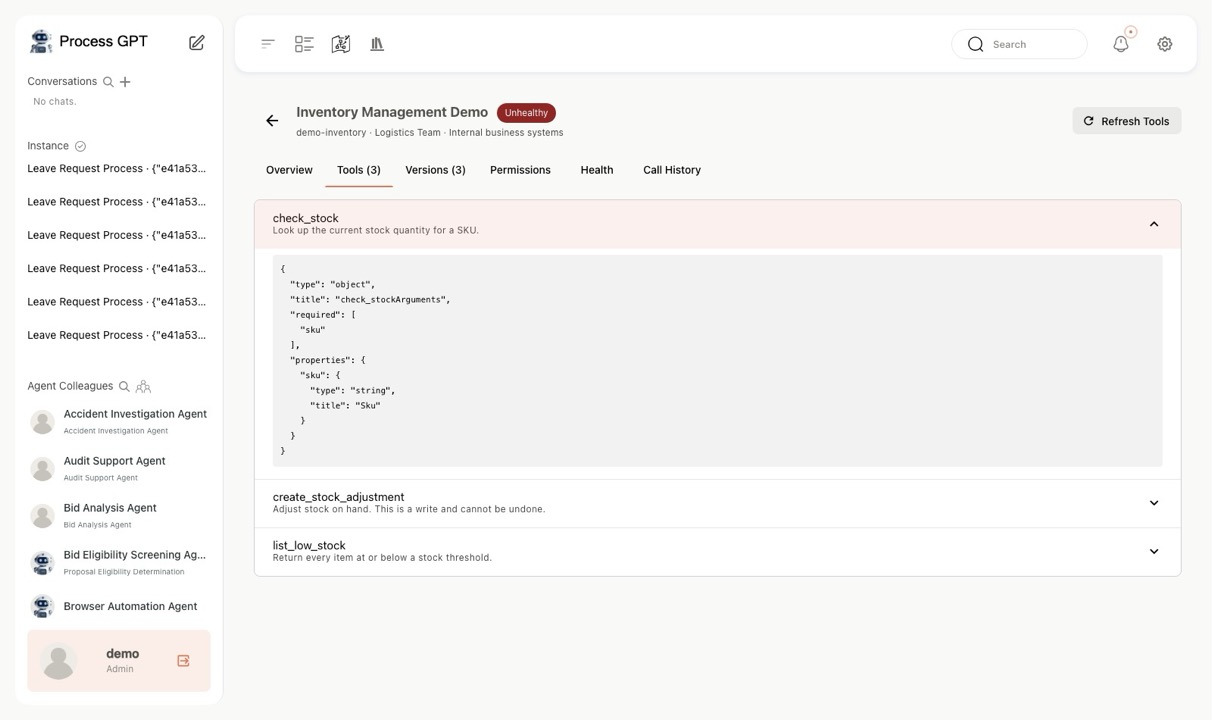
Review each tool's input schema and select individually which tools the agent may use.
▶ Version control: configuration history and restoring previous versions
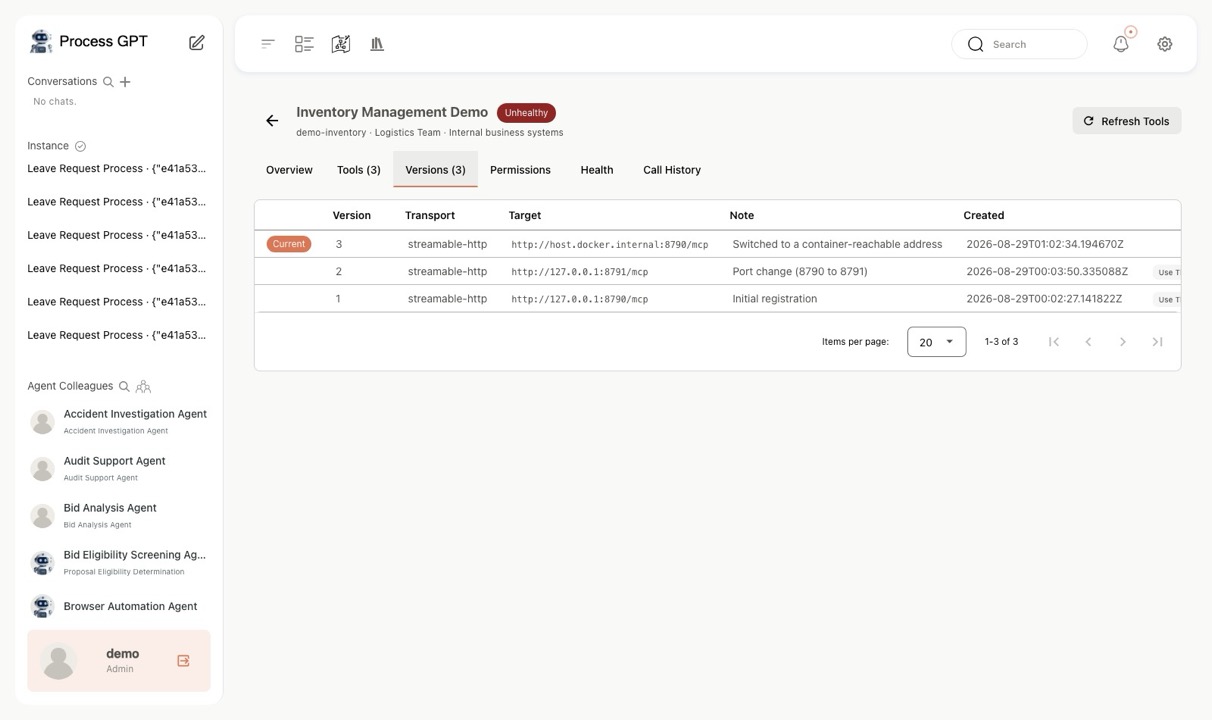
Changing a setting creates a new snapshot. Existing snapshots are retained, and a previous version can be restored whenever needed.
▶ Access permissions — per role, user and agent
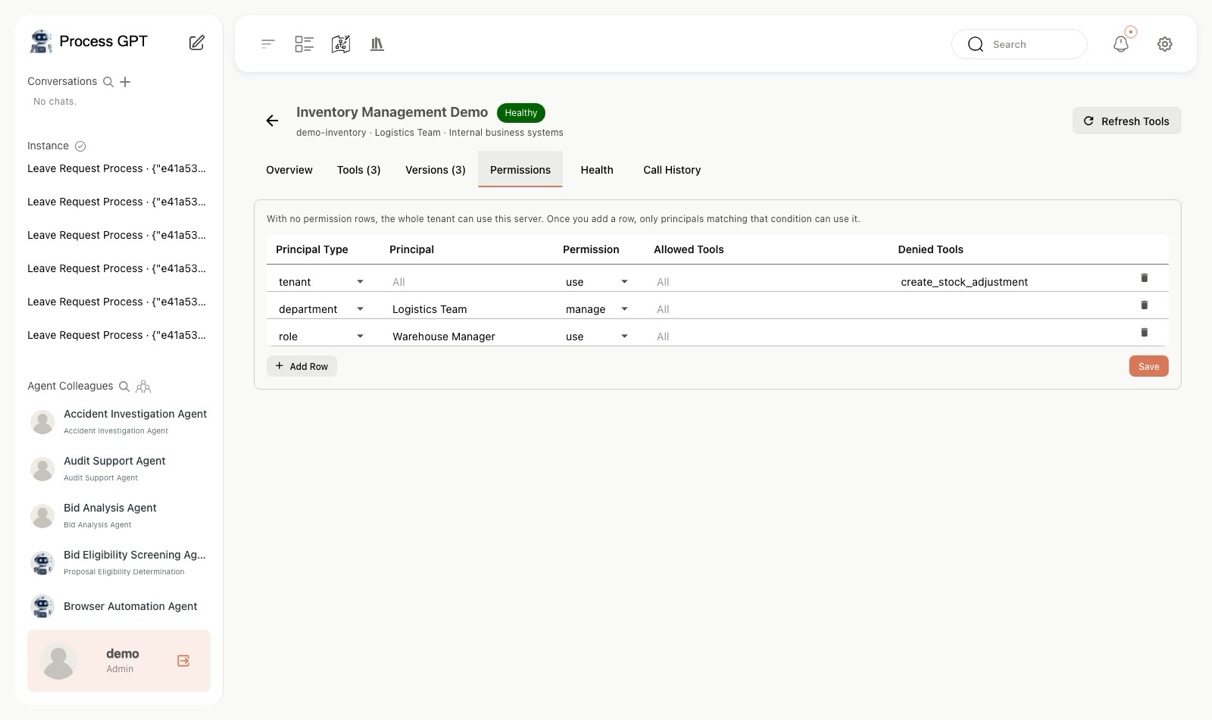
Set permissions per role, user and agent, and individually restrict the use of tools that modify data.
▶ Call history: see which process originated a request
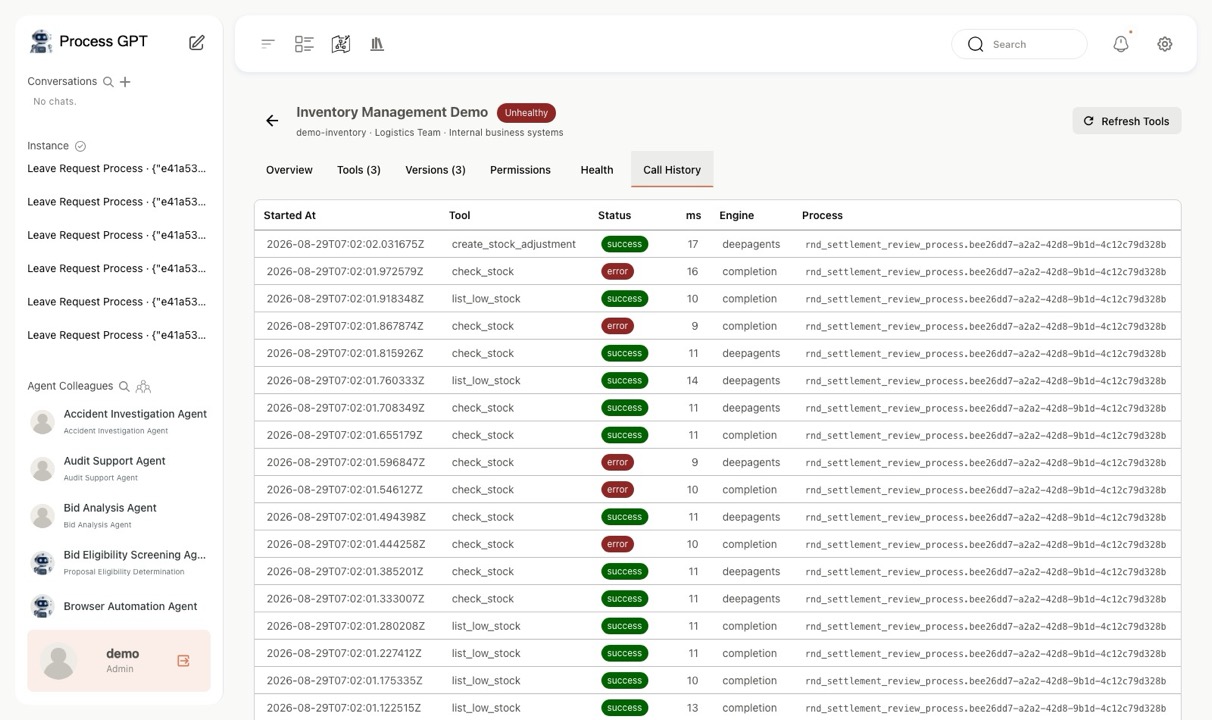
See which process instance each call originated from.
3. Find servers in the gallery and the registry
In the gallery you can select and install pre-registered servers. The gallery list is bundled with the repository, so it is available even in environments without external internet access. Actual installation and connection require the runtime environment and network access the server needs.
In environments with external connectivity, you can also search the official MCP registry. If the registry is unreachable, that search feature is disabled and the built-in gallery is provided instead.
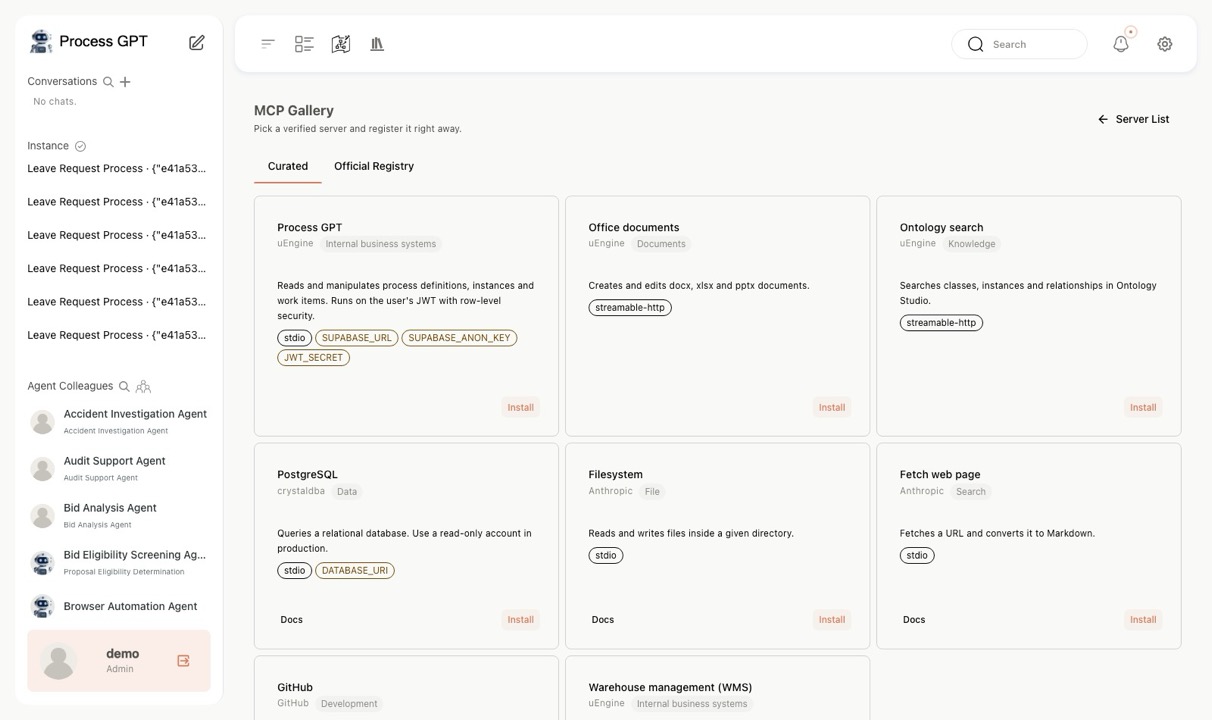
Select and install registered servers from the gallery. The built-in list can be viewed without connecting to an external registry.
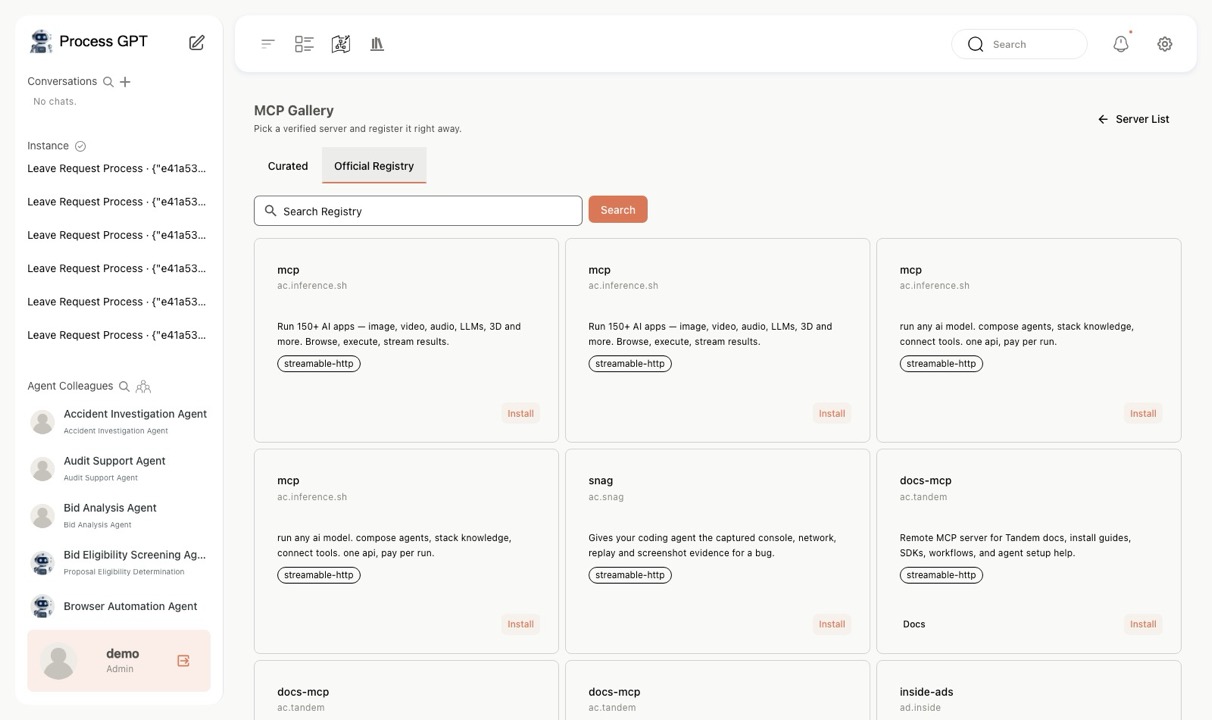
Supports searching the official MCP registry, falling back to the built-in gallery when no external connection is available.
4. Review call metrics and detailed execution records
The observability dashboard shows total calls, success rate and P95 response time, aggregated from actual call records. P95 means that 95% of all calls responded within that time. Response time and error rate per server and per tool are also available.
Select an individual call to see its input and output along with the linked process instance and work item. Through the same trace ID, language-model calls recorded in the LiteLLM proxy can be traced as well.
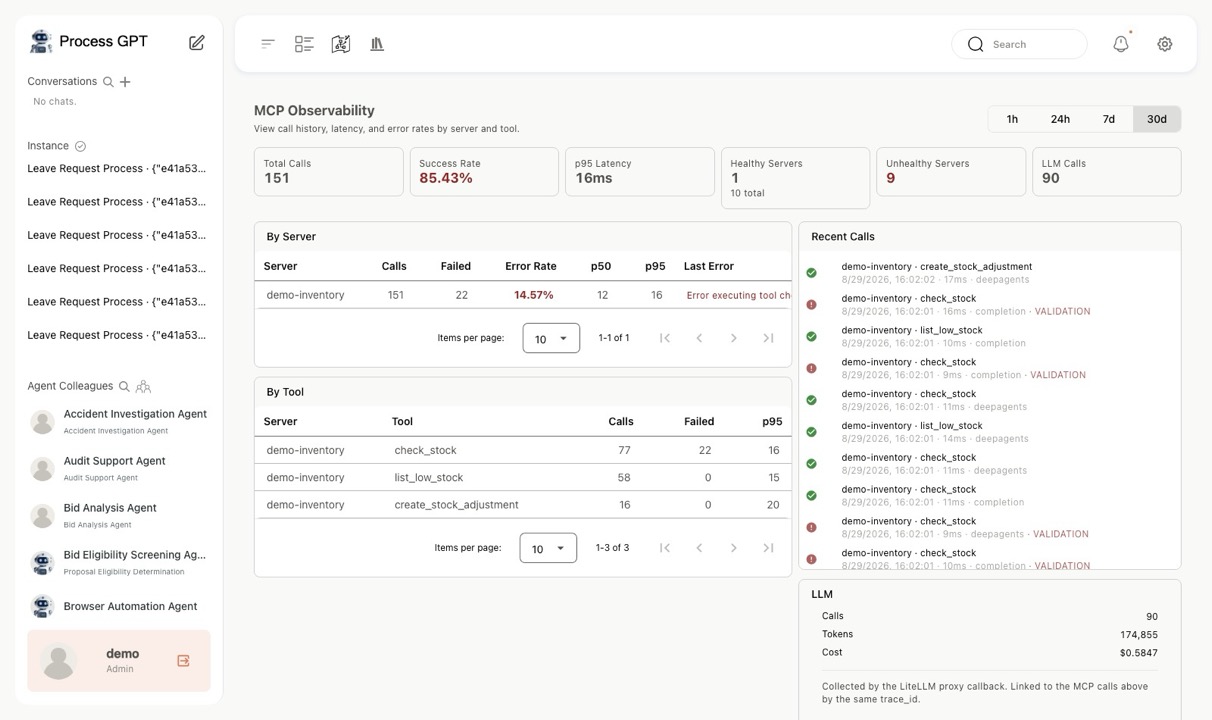
Review overall call metrics plus response time and error rate per server and per tool.
▶ Detailed tracing: linking tool calls and language-model calls
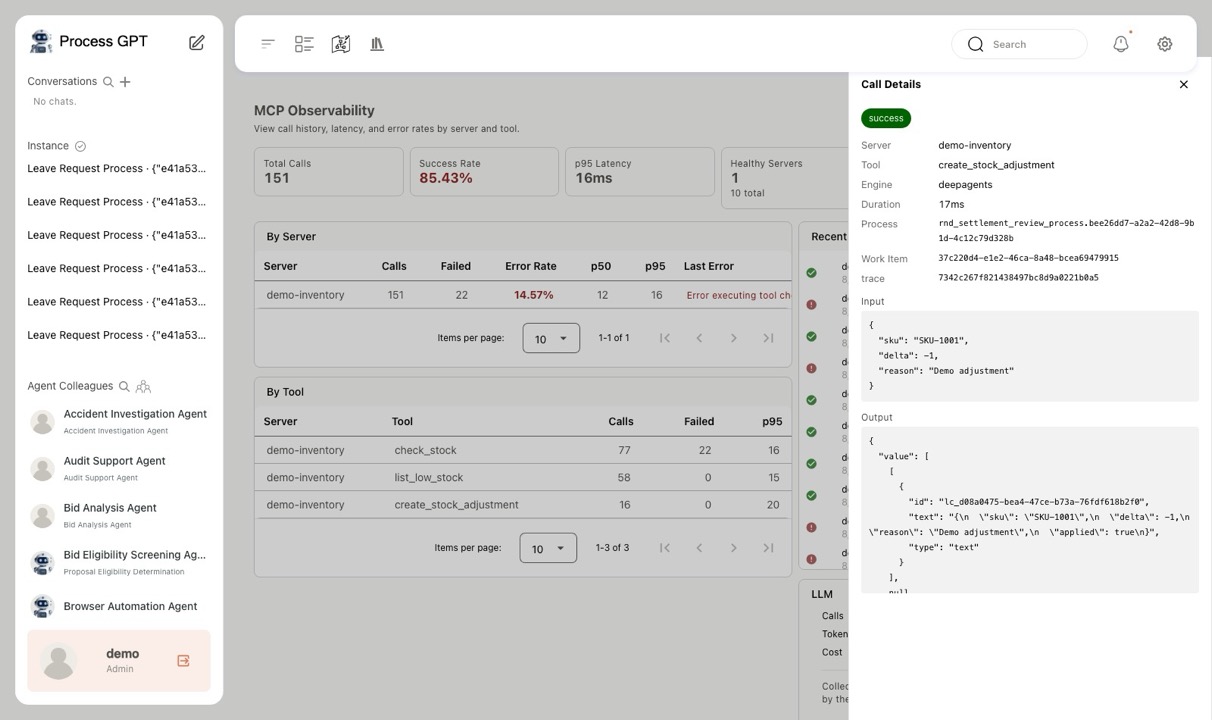
Review each call's input, output and related work, and trace the language-model calls through the same trace ID.
5. Distinguish the roles of processes, workflows and MCP tools
A flow that is processed automatically inside systems, even with many steps, has different management requirements than work that needs approvals and waiting across multiple departments.
In this setup, work that manages departmental roles and approval history goes into BPMN processes, automated system-to-system processing into n8n workflows, and individual capability calls into MCP tools. Roles are divided not by node count but by which work-management functions are needed—assignee allocation, approvals, long waits and so on.
6. Check integration-standard compliance at registration
The integration standard applied to in-house MCP servers covers the transport, how credentials are referenced, tool naming rules, error classification and response time.
Before registration, connection status, naming rules, schema descriptions, response time and more are checked automatically and the result is shown as an A, B or C grade. Operators can see the level of standard compliance and the items to fix at the registration stage.
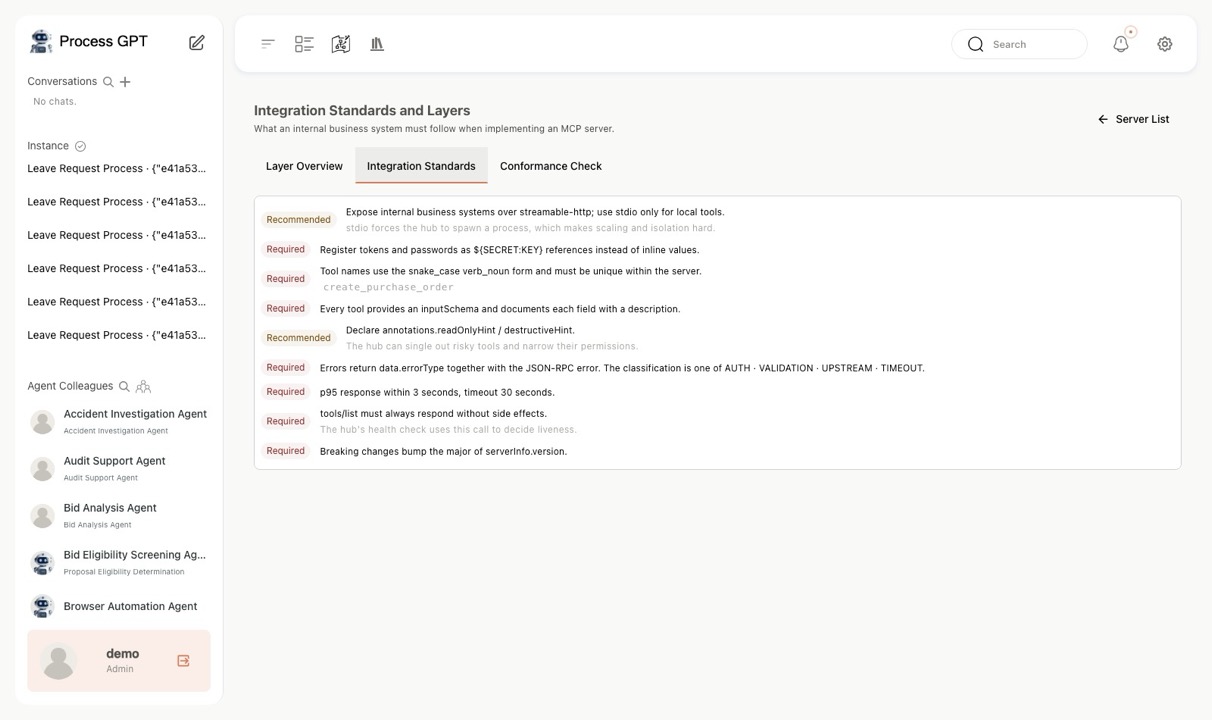
Review the connection method, credential management, naming rules, error classification and response-time criteria in the integration standard.
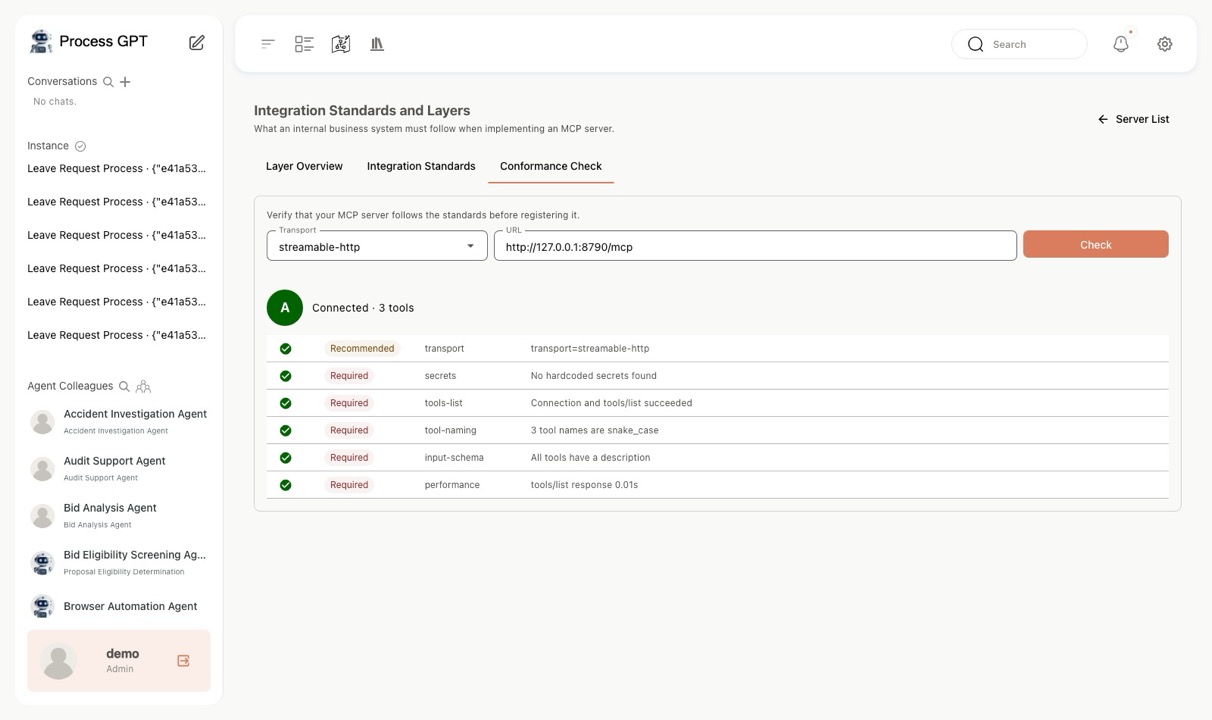
Pre-registration automated check results are shown as A, B or C grades.
How management changed with the MCP Hub
| Before | MCP Hub |
|---|---|
| Connection details managed in per-tenant JSON settings | Servers, tools, versions and permissions managed separately |
| Connection settings verified at execution time | Connection test and standard-compliance grade before saving |
| Capabilities connected at the server level | Tool-level selection and access permissions |
| Separate history tracking needed to restore previous settings | Previous versions restored from configuration snapshots |
| Digging through related logs to find the cause of errors | Related process and language-model calls traced from the call history |
See it in Process GPT
| Concept in this article | Process GPT capability |
|---|---|
| Select the tools you need and call in-house systems | MCP/A2A-based multi-agent execution ↗ See it on the product page |
| Manage departmental roles and approvals as processes | BPMN-based human–agent collaboration design ↗ See it on the product page |
| Connect business concepts scattered across systems | Ontology-based knowledge linking ↗ See it on the product page |
The MCP Hub is built into Process GPT. See it for yourself at process-gpt.io.